

If you work in digital marketing or analytics, you know how much time it takes to build dashboards from scratch. Looker Studio templates solve this by giving you pre-designed layouts where the key charts, filters, and KPIs are already in place, so you can focus on analyzing campaign performance instead of setting up reports.
In this post, you’ll find 10 free Looker Studio templates made specifically for marketing. Each one is fully editable, works with multiple data sources like Google Ads, Meta Ads, or GA4, and is ready to use in just a few clicks.
All templates in this article are available in the free Looker Studio template gallery by Dataslayer. You can copy them, connect your own data, and start reporting right away.
Want to learn how templates work or how to build your own? Check out our complete guide to Looker Studio templates.
Why Use Free Looker Studio Templates for Marketing?
Templates save hours of design and setup time. Instead of building charts, filters, and layouts manually, you can plug in your data and start reporting instantly. They’re ideal for:
- Standardizing reports across clients or teams
- Presenting KPIs with a clear visual context
- Speeding up your reporting workflow
- Reducing setup errors and formatting issues
- Customizing dashboards quickly to match your brand or client needs
Most importantly, they let you focus on insights, not formatting.
How to Use These Looker Studio Templates
You don’t need technical knowledge to use these templates, they’re designed to work seamlessly with Dataslayer’s connectors.
Here’s how to get started:
- Go to the Dataslayer Looker Studio template gallery.
- Choose a template and make a copy in your Google account.
- Connect your own data using any Dataslayer connector (Google Ads, Meta Ads, GA4, etc.).
- Adjust filters, time ranges, and visuals to fit your needs.
- Share the report or set up automatic updates using Looker Studio’s built-in scheduling.
By using Dataslayer as your connector, the setup is fast, no coding is required, and the templates work out of the box.

10 Free Looker Studio Templates You Can Start Using Today
These templates are available in the Dataslayer Looker Studio template gallery. Each one is ready to use, easy to customize, and fully compatible with Dataslayer connectors.
1. Google Analytics 4 Template
A ready-made dashboard that helps you understand how users interact with your website, from acquisition to engagement. Easily track sessions, bounce rate, conversions, and source/medium data. Ideal for content teams, product managers, and performance marketers who want quick, visual insights from GA4.
Data source: Google Analytics 4
2. Facebook Ads & Google Ads Report Template
Combine your Meta Ads and Google Ads performance in one report to compare channels side by side. Great for identifying which platform drives more efficient results, tracking conversion costs, or presenting cross-channel ROI to clients or stakeholders.
Data sources: Facebook Ads & Google Ads
3. Facebook Ads Template
A detailed, Spanish-language dashboard for monitoring campaign performance on Meta platforms. Quickly spot trends in cost, CTR, and results over time. Fully modifiable, so you can adjust it to fit different accounts or switch the language to English.
Data source: Facebook Ads
Language: Spanish (modifiable)
4. Criteo Campaign Performance
This template helps e-commerce marketers track campaign results on Criteo without custom setup. Visualize key metrics like spend, impressions, and conversions to evaluate ad efficiency and optimize for ROI. A good fit for remarketing and dynamic product ads.
Data source: Criteo
Language: English (modifiable)
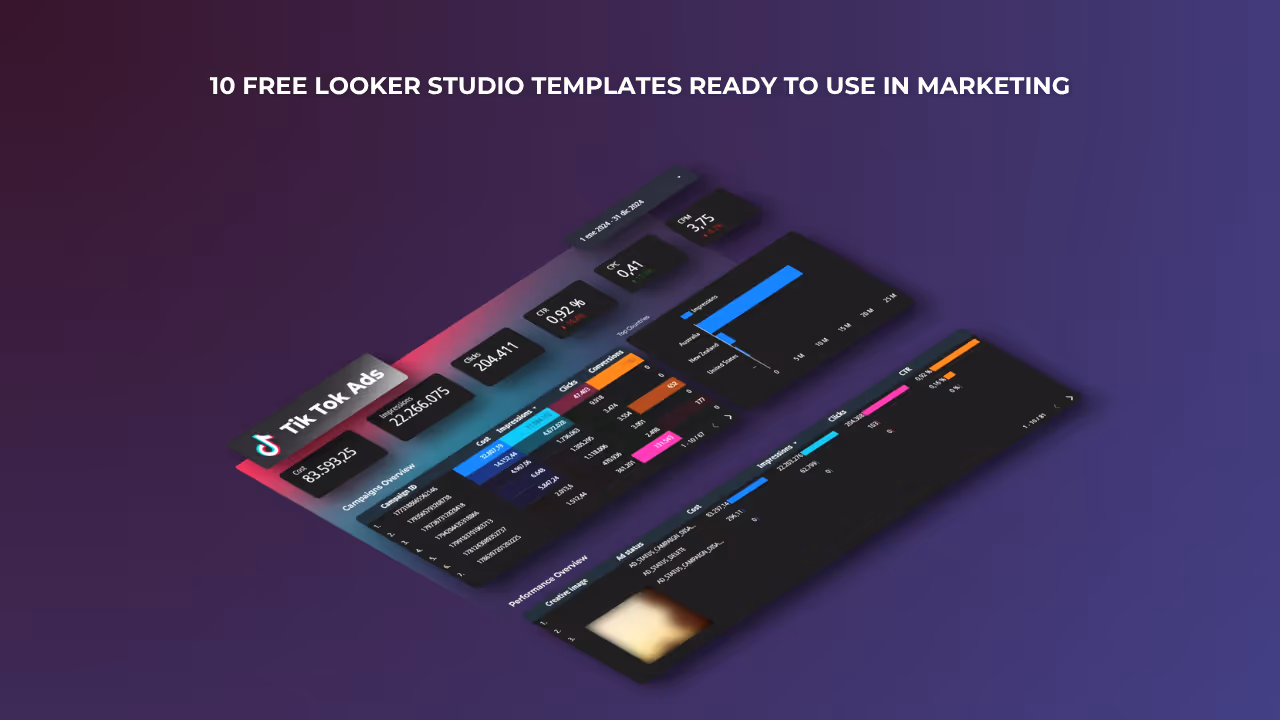
5. TikTok Campaign Performance
Monitor how your TikTok Ads are performing across views, engagement, and conversions. This dashboard is perfect for brands investing in short-form video and influencer content, giving clear visibility into top-performing creatives or ad sets.
Data source: TikTok Ads
Language: English (modifiable)
6. Facebook Ads Efficiency Report (English)
Evaluate the cost-effectiveness of your Meta Ads campaigns with this focused dashboard. It highlights cost per result, conversion rate, and frequency to help you fine-tune your strategy and reduce wasted spend.
Data source: Facebook Ads
Language: English (modifiable)
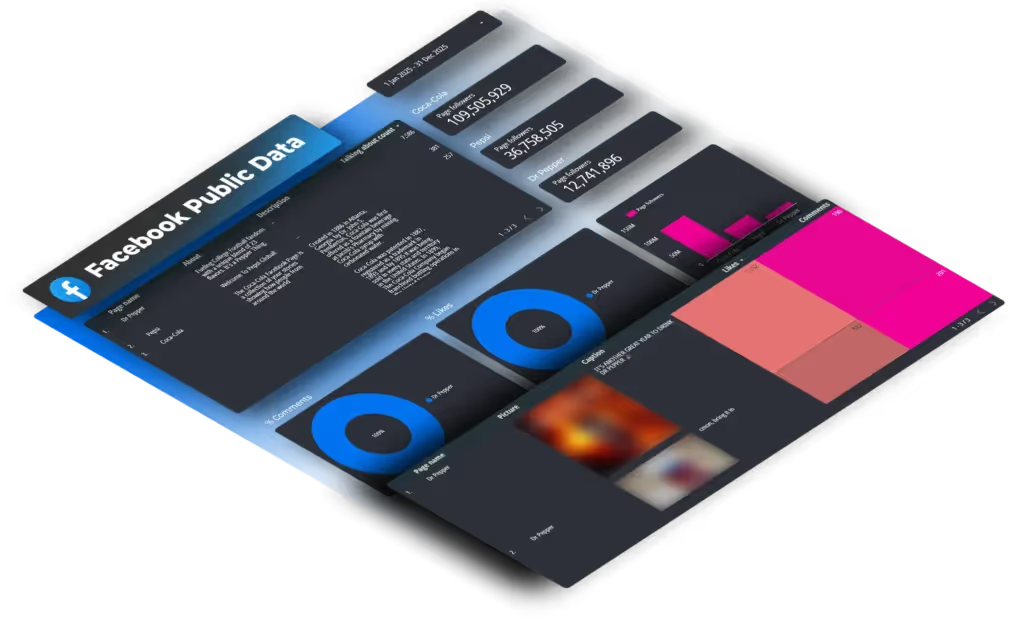
7. Facebook Public Data – Competitors Report (English)
Gain insights into your competitors’ ad strategies using publicly available Meta Ad Library data. This template is ideal for benchmarking your brand’s presence and spotting opportunities based on your industry peers’ active campaigns.
Data source: Facebook Public Data
Language: English (modifiable)
8. LinkedIn Insights – Performance Overview (English)
Understand how your LinkedIn page is performing in terms of engagement, reach, and audience growth. Whether you're doing employer branding or B2B content marketing, this template gives a simple, shareable view of your LinkedIn metrics.
Data source: LinkedIn Pages
Language: English (modifiable)
9. Google Ads Overview Report
This template gives you a clear summary of Google Ads campaign performance, including impressions, conversions, and cost efficiency. Use it to track daily performance, compare periods, or quickly share results with clients or decision-makers.
Data source: Google Ads
10. E-commerce PPC Dashboard
Built for ecommerce marketers running paid campaigns, this dashboard brings together Google Ads and GA4 data to analyze the full customer journey. Track spend, revenue, conversion paths, and ROAS in one place, with visual breakdowns by device or channel.
Data sources: Google Analytics 4 & Google Ads
Customizing Templates for Your Brand or Clients
All Looker Studio templates from Dataslayer are 100% editable, so you can adapt them to your brand guidelines or client needs in just a few steps.
Here’s how to customize them effectively:
Change logos and branding
- Click on any image component in the template (e.g., company logo).
- In the right-hand panel, select “Replace image” and upload your logo.
- Adjust the position and size to fit the layout.
You can also remove the existing logo if you prefer a cleaner look.
Modify colors and fonts
- Select a text box, chart, or shape.
- Use the “Style” tab to change background colors, font types, sizes, and text colors.
- To apply consistent branding, update these elements across all pages.
Tip: Create a brand style guide in a “Theme” to apply it consistently.
Edit metrics and dimensions
Templates give you structure, but the real value comes when you adapt that structure to fit your specific goals. Start by reviewing which metrics are truly meaningful to your team or client. Just because a chart includes “CTR” doesn’t mean it’s the most important KPI for your campaign.
You can easily adjust this by:
- Replacing default metrics (e.g., switching from “Sessions” to “Qualified Leads”).
- Removing metrics that don’t align with your strategy.
- Adding calculated fields to track things like cost per acquisition, lead value, or funnel drop-off.
You can also tailor the labels, section names, and titles within the dashboard to reflect your own terminology. A report that uses your team’s actual language feels familiar and is easier to interpret, especially when shared across teams or with clients.
The goal isn’t just to display data, it’s to display the right data in the way your team works with it.
Add your own data sources
All templates work with Dataslayer connectors. Once copied, just:
- Click “Edit data source” in the top-right corner.
- Select your own connected source (e.g., Google Ads, GA4).
- Apply the data source to all pages.

Use These Templates Today with Your Own Data in Looker Studio
Looker Studio templates are a great starting point, but the real value comes when you connect them to your actual data. With Dataslayer, you can integrate platforms like Google Ads, Meta Ads, GA4, TikTok, and more into any template in just a few clicks. Skip the manual setup, avoid complex scripts, and get straight to reporting.
Want to see these templates in action with live data?
👉 Start your free trial of Dataslayer and connect your marketing sources to Looker Studio today.
Frequently Asked Questions (FAQs)
Where can I find free Looker Studio templates?
You can explore a collection of free Looker Studio templates in the Dataslayer template gallery, built specifically for marketers and analysts.
How do I connect my data to a Looker Studio template?
After copying a template to your Google account, you can connect your own data by selecting “Edit data source” in the top menu. Choose your preferred connector, such as Google Ads, GA4, or Meta Ads, using Dataslayer’s integrations.
Do these templates update automatically?
Yes. Once you connect a live data source, your template updates in real time or on a scheduled refresh.
Are Looker Studio templates editable?
Yes, every template is fully customizable. You can change charts, metrics, filters, colors, logos, and text to match your brand or reporting needs. This makes them ideal for agencies, in-house teams, or client-facing dashboards.
How do I make a copy of a Looker Studio template?
Click the “Use this template” button in the gallery. This will open the template in Looker Studio where you can select “Make a copy” and replace the default data source with your own.
Can I share these templates with my team or clients?
Absolutely. Looker Studio allows you to control access and sharing settings. You can share a live version, export to PDF, or schedule email updates, perfect for internal reporting or client deliverables.


