
Using BigQuery data in Looker Studio is an easy way of building clean, shareable, custom reports or dashboards for your data. Given that Looker studio connects seamlessly to Google BigQuery, you can create powerful reports that could never be possible elsewhere.
If you are a data analyst or a business analyst who wants to take your data reporting to the next level, Looker Studio is surely a perfect tool. This article is ideal for you if you want a complete guide to help you learn how to load your Google BigQuery Data into Looker Studio.
So, read on!
Why use Google BigQuery
Today, for any company, business data gets accumulated at a record pace. From customer relationship management (CRM) data to web analytics, all the facets of a business require the collection of data of some sort.
And therefore, there is an increasing need to find solutions and tools that allow us to store and analyze all our data swiftly without getting overwhelmed by the huge amounts of it. Thankfully, Google BigQuery offers this functionality to help businesses make the most of their datasets while enabling data-driven decision-making for the companies.
While Google BigQuery is suited for Big Datasets and analytics, it is also ideal for datasets that do not change much. This could be Big Data at the end of an ETL pipeline or thoroughly processed data that requires little or no more data manipulation.
Furthermore, BigQuery uses a BI engine having a powerful inbuilt cache system that explains why you shouldn’t use it for data that changes much more often.
Why use Looker Studio
As you know, data is crucial for business analytics and better decision-making. However, the amounts of data companies collect keep rising and can overwhelm even the most dedicated data analysts.
While businesses should keep accumulating data about their market, customers, competitors, and the company itself, it is essential to be on the lookout for effective strategies to help you visualize your data, making it usable for your needs.
Looker Studio is a powerful tool that allows you to create reports and dashboards to present your data visually and beautifully. Thus, it is our ideal tool for our challenges in making sense of our data.
Potential costs of using BigQuery
Some Google Cloud features you may use to load your data to Looker Studio are billable, as you may incur some costs. These components include:
BigQuery: There may be storage costs for the tables you create, so check them out.
BI Engine: If you use the BI Engine, you may incur monthly costs for the reservations you create.
If you want to estimate the costs, use the pricing calculator to project your potential usage costs. You can also check out the pricing for BigQuery storage and the BI Engine pricing page to know more.
How does Looker Studio connect to BigQuery?
Looker Studio uses its connector tool to connect to data from external sources. To use this data source connector tool to load your BigQuery data into Looker Studio, follow the following steps:
How to import BigQuery data into Looker Studio
The first thing you need to do to load your data into Looker Studio. Then, open a new report or an existing one you want to use with your BigQuery data. Once it is ready, select the BigQuery data source. How do you do that? Here’s the process:
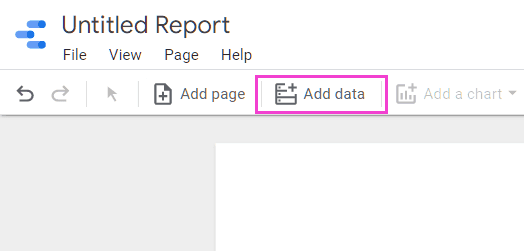
- After creating or selecting a report you want to work with, you can rename it and click Add data to add your tables from BigQuery.
- On the Add data window, select BigQuery from the list. If you can’t see it, use the search bar to find it.
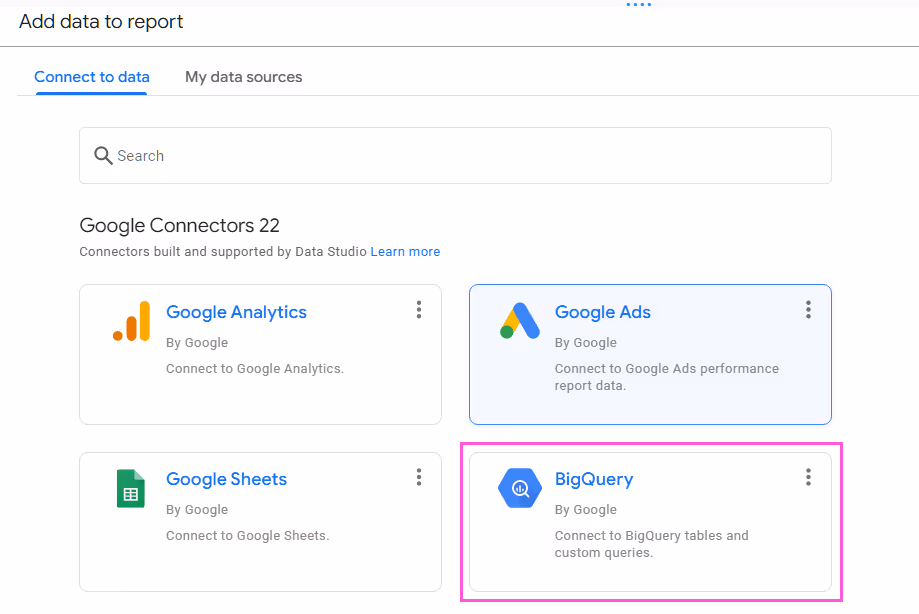
- If it is your first time connecting Looker Studio with BigQuery data, you will be prompted to give permissions to Looker Studio. So, click Authorize to authorize Data Studio to access your Google Cloud projects and Allow on the Request for permission dialog to share permissions for it to view your data.
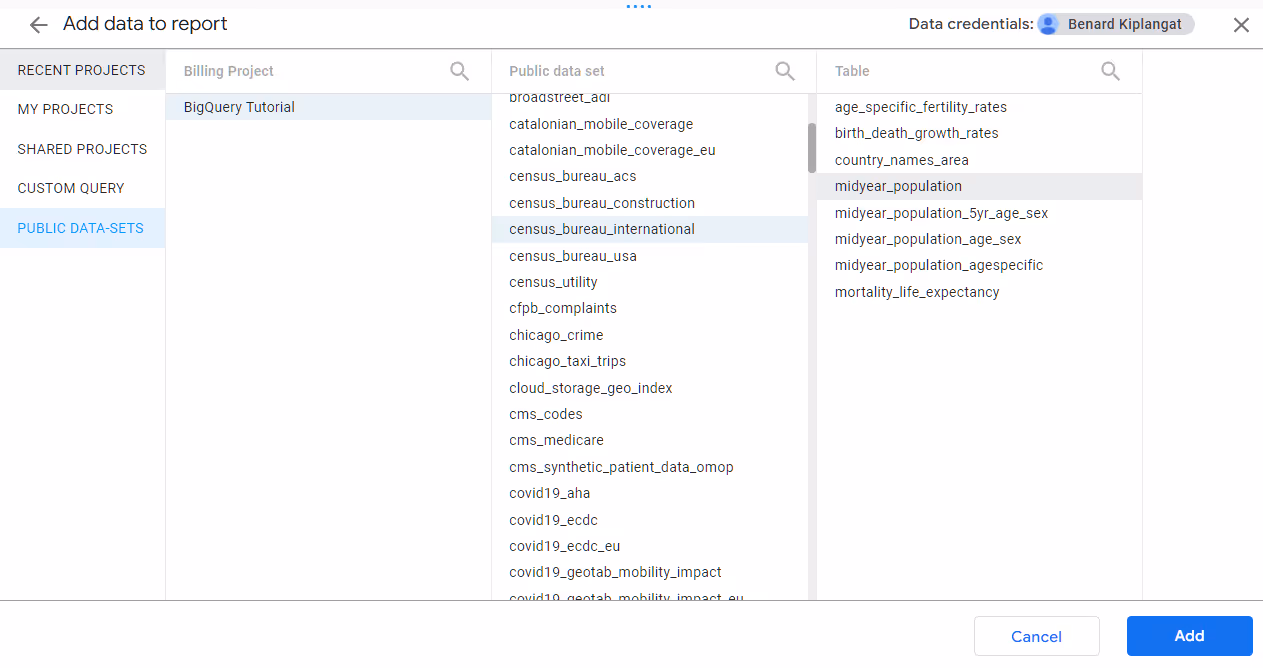
- Once you select BigQuery, select the BigQuery project having the tables you want to use in Looker Studio. Then select the Data set and finally the table.
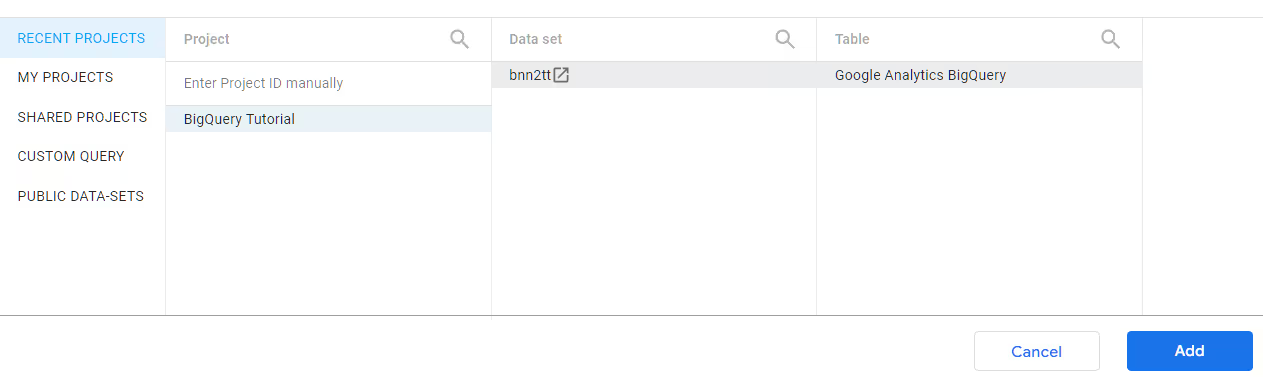
Use BigQuery projects to load your tables in Looker Studio.
There are four options to get Google BigQuery data on Looker Studio. You can get it directly from your listed projects, shared projects, custom query, or public datasets. So, choose accordingly.
Repeat the process above for each table if you have several that you want to load from BigQuery.
Visualizing your data in Looker Studio
Now that you have imported your BigQuery data into Looker Studio automatically, you can choose to blend your data with other data sources and visualize them in charts. So, let’s try to visualize the BigQuery table we just created!
More on data blending: 7 Limitations of Data Blending in Google Data Studio (And How To Overcome) | Dataslayer
We will create a bar chart to display the distribution of the population by country, so follow along with the following process:
To create a bar chart that displays the population distribution by country:
- On your report editor, click Insert Bar chart.
- You can expand the chart size to the ideal size using its handles.
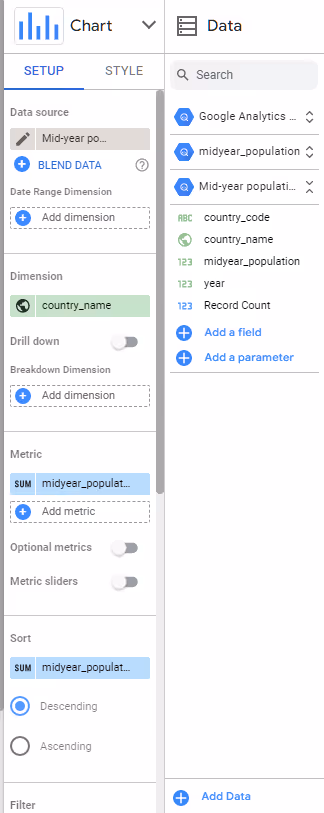
- Ensure that you are using the right metrics and dimensions for your charts. We used the country_name as the dimension, the year as the Breakdown Dimension, and the population size as the metric for our example.
- Next, we need to select only a few countries from the list, so we will add a filter clause to pick those we want. We want to include countries with a midyear population size above or equal to 200,000,000 and the year between 2040 and 2044.
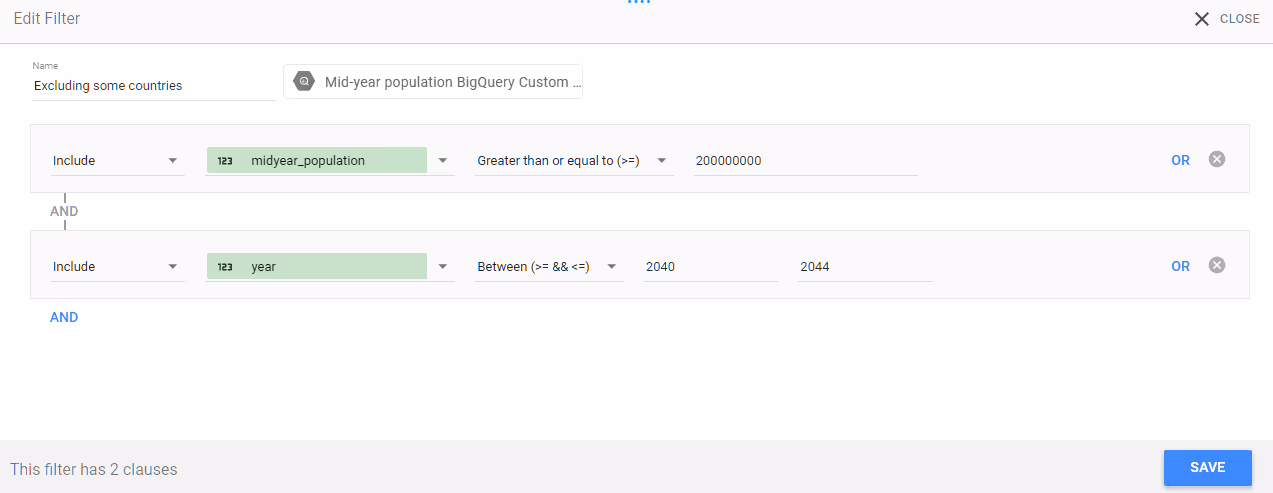
- Click Add filter on the Data tab, then Add a filter option or Create a filter if you have other filters already. You can name your filter if you need, then, choose Include. Select the field as midyear population and condition as Greater than or Equal to (>=), and use the value 200,000,000.
- Next, use the AND condition, then use Include, year, Between (>=&&<=), 2040, and 2044 respectively. Finally, click Save to apply the filter.
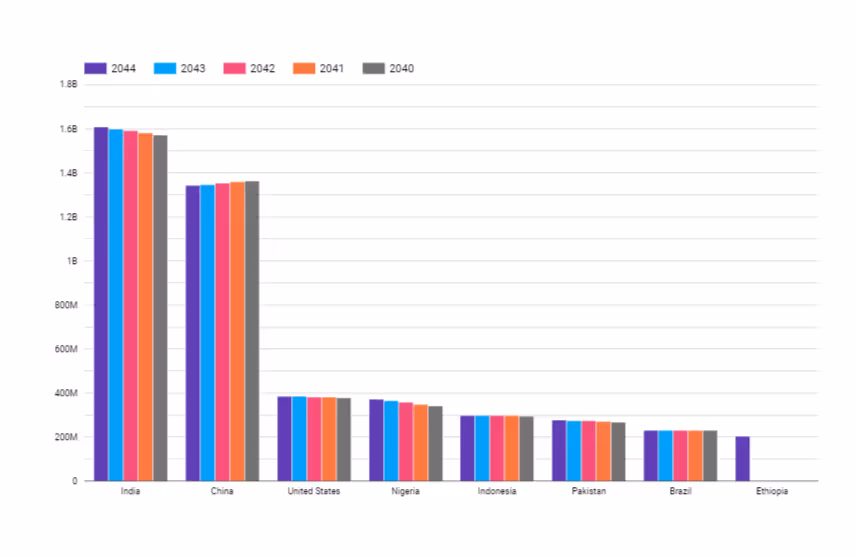
- After applying your filter, your chart should look like this:
Ready to visualize your BigQuery data in Looker Studio?
Creating reports from BigQuery data in Looker Studio is not as complex as you’ve seen. However, because you are dealing with large datasets, complexity can quickly set in. So, keep your reports clean and organized to make the most value for your data reporting.
Moreover, Looker Studio caches your data when connecting to BigQuery, so use BigQuery data that changes less often. Also, querying the BigQuery BI Engine more often for huge datasets may unnecessarily raise your costs.
What other connector tools can you use to get your data from BigQuery or any other data source?
If you want a custom tool to simplify your data transfer from Google BigQuery to Google Data Studio, consider using Dataslayer.ai. We also offer custom connectors to over 40 data sources to Google Sheets, Google Data Studio, and other BI tools.
Also, if you want to transfer your BigQuery data, Dataslayer BigQuery will be a perfect tool for you. Want to try it for free? Sign up today to get your free trial!


