

.png)
The landscape of marketing analytics has evolved dramatically over the past few years, and as we navigate through 2026, the sophistication and importance of marketing reports have reached unprecedented levels. Today's marketing professionals face an increasingly complex ecosystem where data flows from dozens of platforms simultaneously, making the ability to create comprehensive, actionable marketing reports not just valuable, but essential for business survival and growth.
Marketing reports serve as the bridge between raw data and strategic decision-making, transforming countless metrics and touchpoints into clear narratives that drive business outcomes. Whether you're managing campaigns across Google Ads, Facebook, LinkedIn, or emerging platforms, understanding how to build, interpret, and act on marketing reports has become a critical competency for modern marketers.
What Are Marketing Reports and Why They Matter More Than Ever
At their core, marketing reports are structured documents that consolidate marketing data from various sources to provide insights into campaign performance, customer behavior, and return on investment. However, in 2026, they've evolved far beyond simple spreadsheets filled with numbers. Modern marketing reports represent sophisticated analytical frameworks that combine quantitative metrics with qualitative context to tell the complete story of your marketing efforts.
The fundamental purpose of marketing reports remains unchanged: to measure effectiveness, identify opportunities, and guide future strategy. What has changed dramatically is the scope and complexity of data available to marketers. Today's professionals routinely manage campaigns across ten or more platforms simultaneously, each generating thousands of data points daily. Without structured reporting processes, this wealth of information becomes overwhelming rather than empowering.
Marketing reports answer critical business questions that executives, stakeholders, and team members need addressed regularly. How are we performing against our goals? Which channels deliver the best return on investment? Where should we allocate budget for maximum impact? What customer segments respond most favorably to our messaging? These questions drive every major marketing decision, and quality reports provide the answers.
The strategic importance of marketing reports extends beyond simple performance tracking. They create accountability within marketing teams, establish benchmarks for success, facilitate cross-functional communication, and provide the evidence base for securing budget and resources. In organizations where marketing increasingly drives revenue growth, the ability to demonstrate value through clear, compelling reports has become a career-defining skill.
Essential Components Every Marketing Report Should Include
Creating effective marketing reports requires understanding which elements provide genuine value versus which simply add clutter. Through years of working with marketing professionals across industries, several components have emerged as universally essential for comprehensive reporting.
Executive summary sections should open every marketing report, providing decision-makers with immediate access to key findings without requiring them to digest every detail. This section distills complex data into three to five critical insights, typically highlighting performance against primary objectives, significant changes from previous periods, and recommended actions. The executive summary respects busy stakeholders' time while ensuring they grasp essential information that impacts strategic decisions.
Performance metrics aligned with business objectives form the substantive core of marketing reports. Rather than presenting every available metric, effective reports focus on those directly connected to organizational goals. For e-commerce businesses, this might emphasize conversion rates, average order value, and customer acquisition cost. B2B companies often prioritize metrics like marketing qualified leads, sales accepted leads, and pipeline contribution. Service businesses might focus on appointment bookings, consultation requests, and customer lifetime value calculations.
The selection of which metrics to include should never be arbitrary. According to research from the Content Marketing Institute, the most successful marketing teams align their reporting metrics directly with revenue outcomes rather than vanity metrics like impressions or follower counts. This alignment ensures reports drive conversations about business impact rather than marketing activity.
Channel-specific performance breakdowns provide the granular detail necessary for tactical optimization. While the executive summary offers the big picture, these sections dive into individual platform performance. Google Ads sections might detail campaign-level results, keyword performance, and quality score trends. Social media sections could analyze engagement rates, reach patterns, and content performance by format. Email marketing sections typically examine open rates, click-through rates, and conversion metrics by segment or campaign type.
Comparative analysis and trend identification transform static snapshots into dynamic narratives. Presenting current period data alongside previous periods reveals whether performance is improving, declining, or remaining stable. Month-over-month, quarter-over-quarter, and year-over-year comparisons each offer different perspectives on performance trends. Visual representations through charts and graphs make these comparisons immediately comprehensible, allowing readers to spot patterns without extensive analysis.
Budget allocation and efficiency metrics address the fundamental question every business leader wants answered: are we spending our marketing budget wisely? These sections compare investment across channels against the returns each generates. Metrics like cost per acquisition, return on ad spend, and customer lifetime value relative to acquisition cost provide the financial context that connects marketing activities to bottom-line business outcomes. For organizations using platforms like Looker Studio for visualization, these efficiency metrics can be particularly powerful when displayed through dynamic dashboards that update automatically.
Audience insights and segmentation analysis reveal who responds to your marketing efforts and how different groups behave. Demographic breakdowns, geographic performance comparisons, and device usage patterns help marketers understand their audience composition. More sophisticated reports incorporate cohort analysis, showing how groups of customers acquired in different periods perform over time. These insights inform targeting strategies, creative development, and channel selection decisions.
Competitive context and market positioning help interpret your performance relative to industry benchmarks and direct competitors. While your conversion rate might be improving, understanding whether you're gaining or losing market share requires external perspective. Industry benchmark data, competitive intelligence where available, and share of voice metrics provide this crucial context.
Types of Marketing Reports for Different Stakeholder Needs
The notion of a single universal marketing report that serves all audiences represents one of the most common mistakes in marketing analytics. Different stakeholders require different information, presented at different levels of detail, with varying update frequencies. Understanding this principle dramatically improves report effectiveness and stakeholder satisfaction.
Executive dashboards serve C-suite leaders and board members who need high-level visibility into marketing's business impact without operational detail. These reports emphasize strategic metrics that directly connect to company objectives: revenue contribution, customer acquisition trends, brand health indicators, and marketing efficiency ratios. Updates typically occur monthly or quarterly, with the entire report consumable in under five minutes. Visual design prioritizes clarity and immediate comprehension, often using stoplight indicators or trend arrows to communicate status at a glance.
Campaign performance reports provide the operational detail marketing managers and specialists require to optimize ongoing initiatives. These reports drill into specific campaigns, examining performance across all active channels, identifying which creative variants perform best, and highlighting opportunities for budget reallocation. Campaign reports update more frequently than executive dashboards, often weekly or even daily for high-investment initiatives. They balance breadth with depth, covering multiple metrics while maintaining focus on actionable insights.
Channel-specific deep dives serve specialists managing particular platforms or tactics. A paid search manager needs extensive detail about keyword performance, ad copy effectiveness, and audience segment behavior within Google Ads. A social media manager requires content performance analysis, engagement patterns, and community growth metrics. These reports can be quite technical, assuming audience familiarity with platform-specific terminology and metrics.
ROI and attribution reports tackle the complex challenge of connecting marketing activities to revenue outcomes. These reports attempt to answer which touchpoints contribute to conversions, how marketing investment translates to sales, and what the true cost of customer acquisition includes across all channels. Attribution modeling, whether first-touch, last-touch, linear, or algorithmic, forms the analytical foundation. These reports often incorporate longer timeframes since customer journeys may span weeks or months between initial awareness and final conversion.
Audience and customer insight reports shift focus from what marketing does to whom it reaches and how they respond. These reports analyze customer demographics, psychographics, behavioral patterns, and journey characteristics. Segmentation analysis identifies distinct customer groups with different needs, preferences, and value profiles. Retention metrics, churn analysis, and lifetime value calculations help organizations understand not just acquisition success but customer relationship quality over time.
The most sophisticated marketing organizations maintain report libraries with templates for each stakeholder type, ensuring consistency while allowing customization for specific situations. This approach balances efficiency with relevance, enabling teams to generate reports quickly without sacrificing the specificity different audiences require.
Building Your Marketing Reporting Infrastructure
Creating sustainable marketing reporting processes requires more than deciding which metrics to track. The technical infrastructure, workflow design, and tool selection fundamentally shape what's possible in your reporting practice and how much time it consumes.

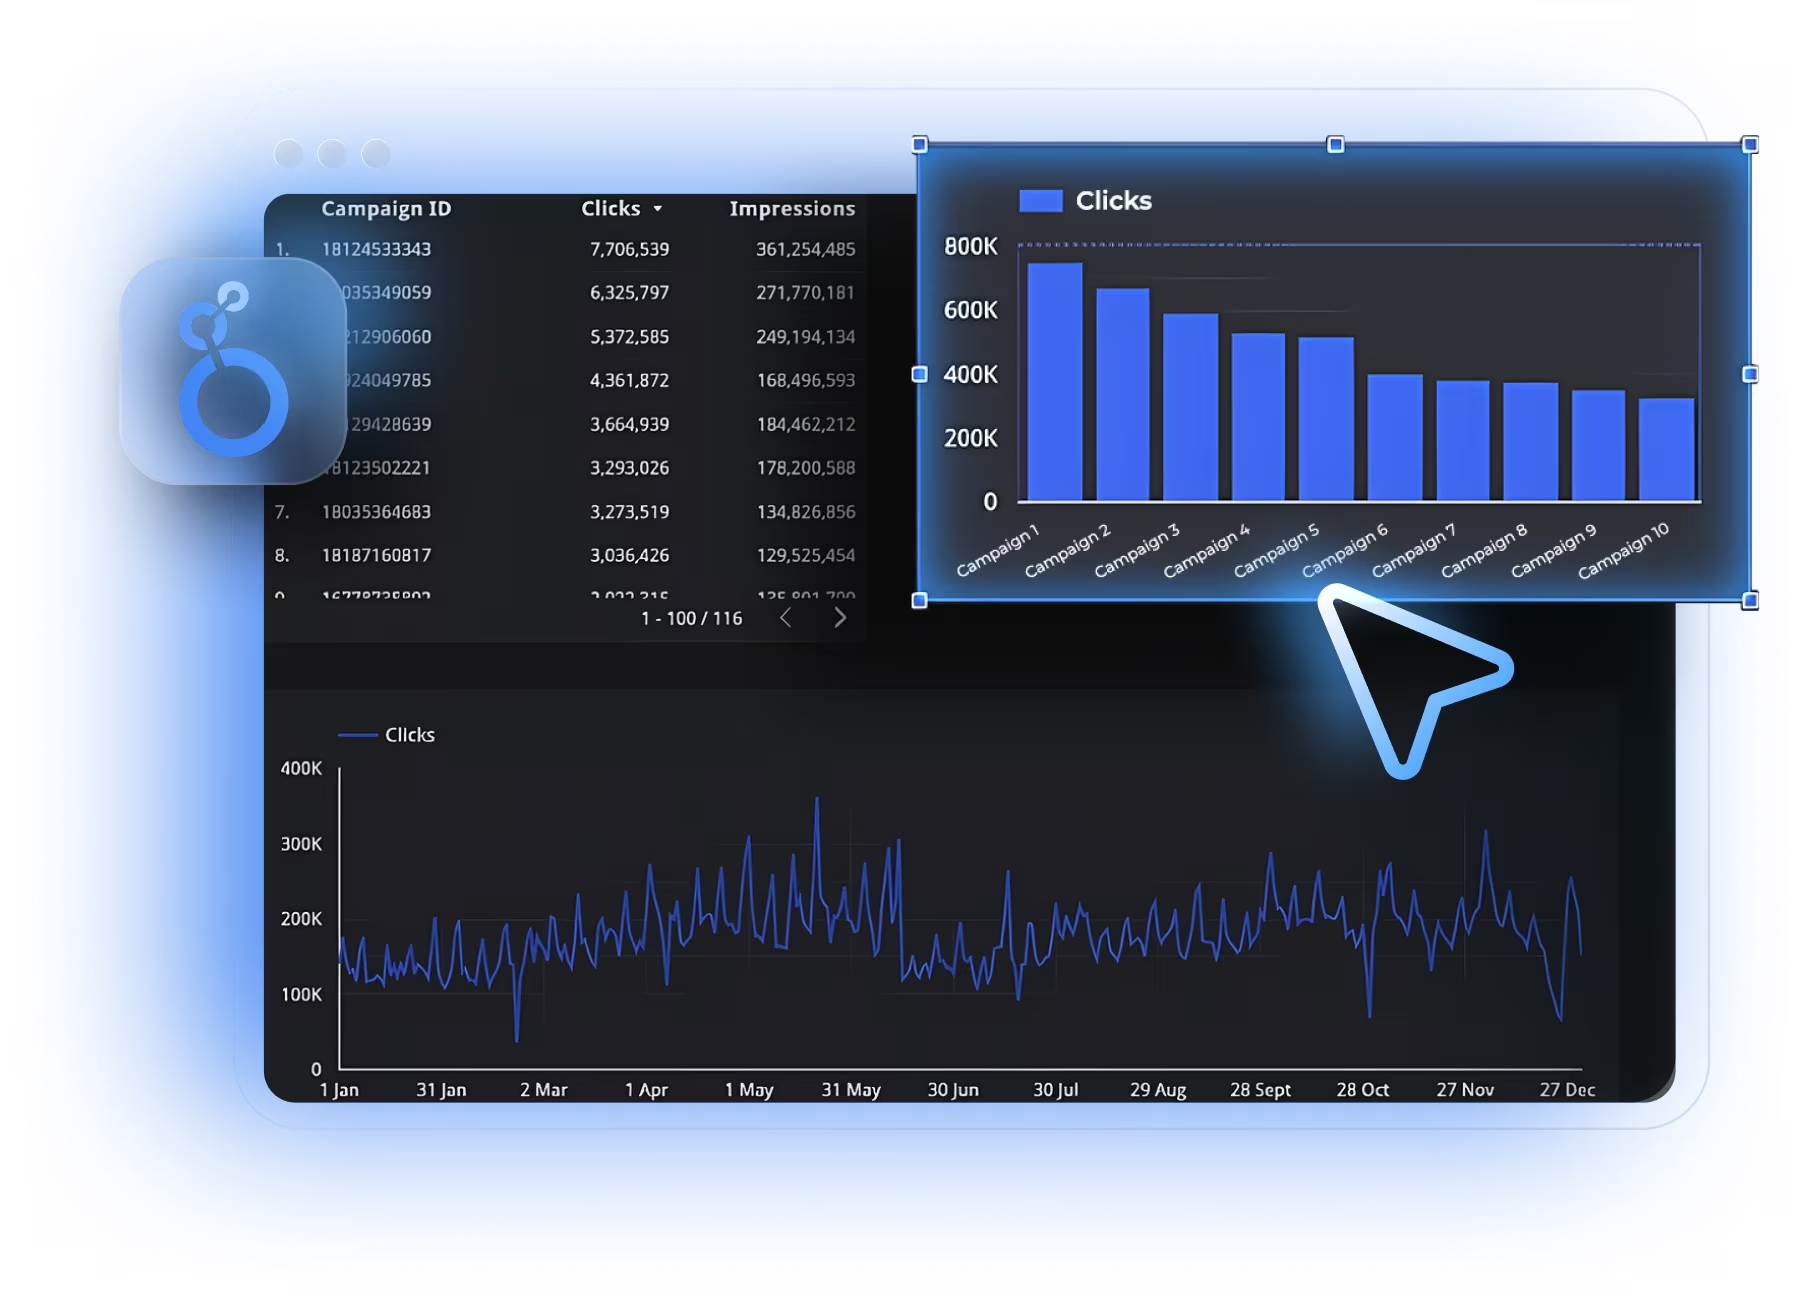
Data consolidation represents the first major challenge most marketing teams encounter. Modern marketing generates data across numerous platforms, each with its own interface, metrics, and export capabilities. Manually logging into Google Analytics, Google Ads, Facebook Ads Manager, LinkedIn Campaign Manager, and other platforms to extract data becomes unsustainable quickly. Even small marketing teams may manage five to ten data sources, while enterprise organizations often exceed fifty active platforms.
This is precisely where modern marketing data integration platforms transform the reporting landscape. Solutions like Dataslayer have emerged as essential infrastructure for marketing teams serious about scalable reporting. Rather than spending hours each week manually copying data from various platforms into spreadsheets, automated integration delivers fresh data to your reporting environment continuously. Dataslayer, for instance, connects to over 50 marketing platforms including Google Ads, Facebook Ads, LinkedIn Ads, TikTok Ads, and Google Analytics 4, consolidating data through secure API connections while maintaining ISO 27001 and ISO 27701 certifications for data security compliance.
The value of automated data integration becomes particularly evident when building reports that span multiple channels. A comprehensive marketing performance report might need to combine Google Ads campaign data, Facebook advertising metrics, LinkedIn lead generation results, and Google Analytics website behavior—all synchronized to the same time periods and formatted consistently. Without integration platforms, assembling this cross-channel view manually could consume an entire day weekly. With proper integration infrastructure, the same report updates automatically in minutes.
Reporting frequency and automation decisions profoundly impact both workload and responsiveness. Some metrics warrant daily monitoring while others need only monthly review. High-stakes campaigns during critical periods might require real-time dashboards, while brand awareness initiatives could suffice with quarterly reports. Automation capabilities determine how much time teams spend on report generation versus analysis and action.
The most efficient reporting infrastructures automate data collection, processing, and distribution completely. Scheduled reports generate automatically and distribute to stakeholders via email or shared dashboards without manual intervention. This automation shifts human effort from mechanical data gathering toward analytical interpretation and strategic response. According to analysis from Google's Looker Studio team, organizations that automate their reporting processes free up an average of fifteen to twenty hours per week for analytical work rather than data preparation.
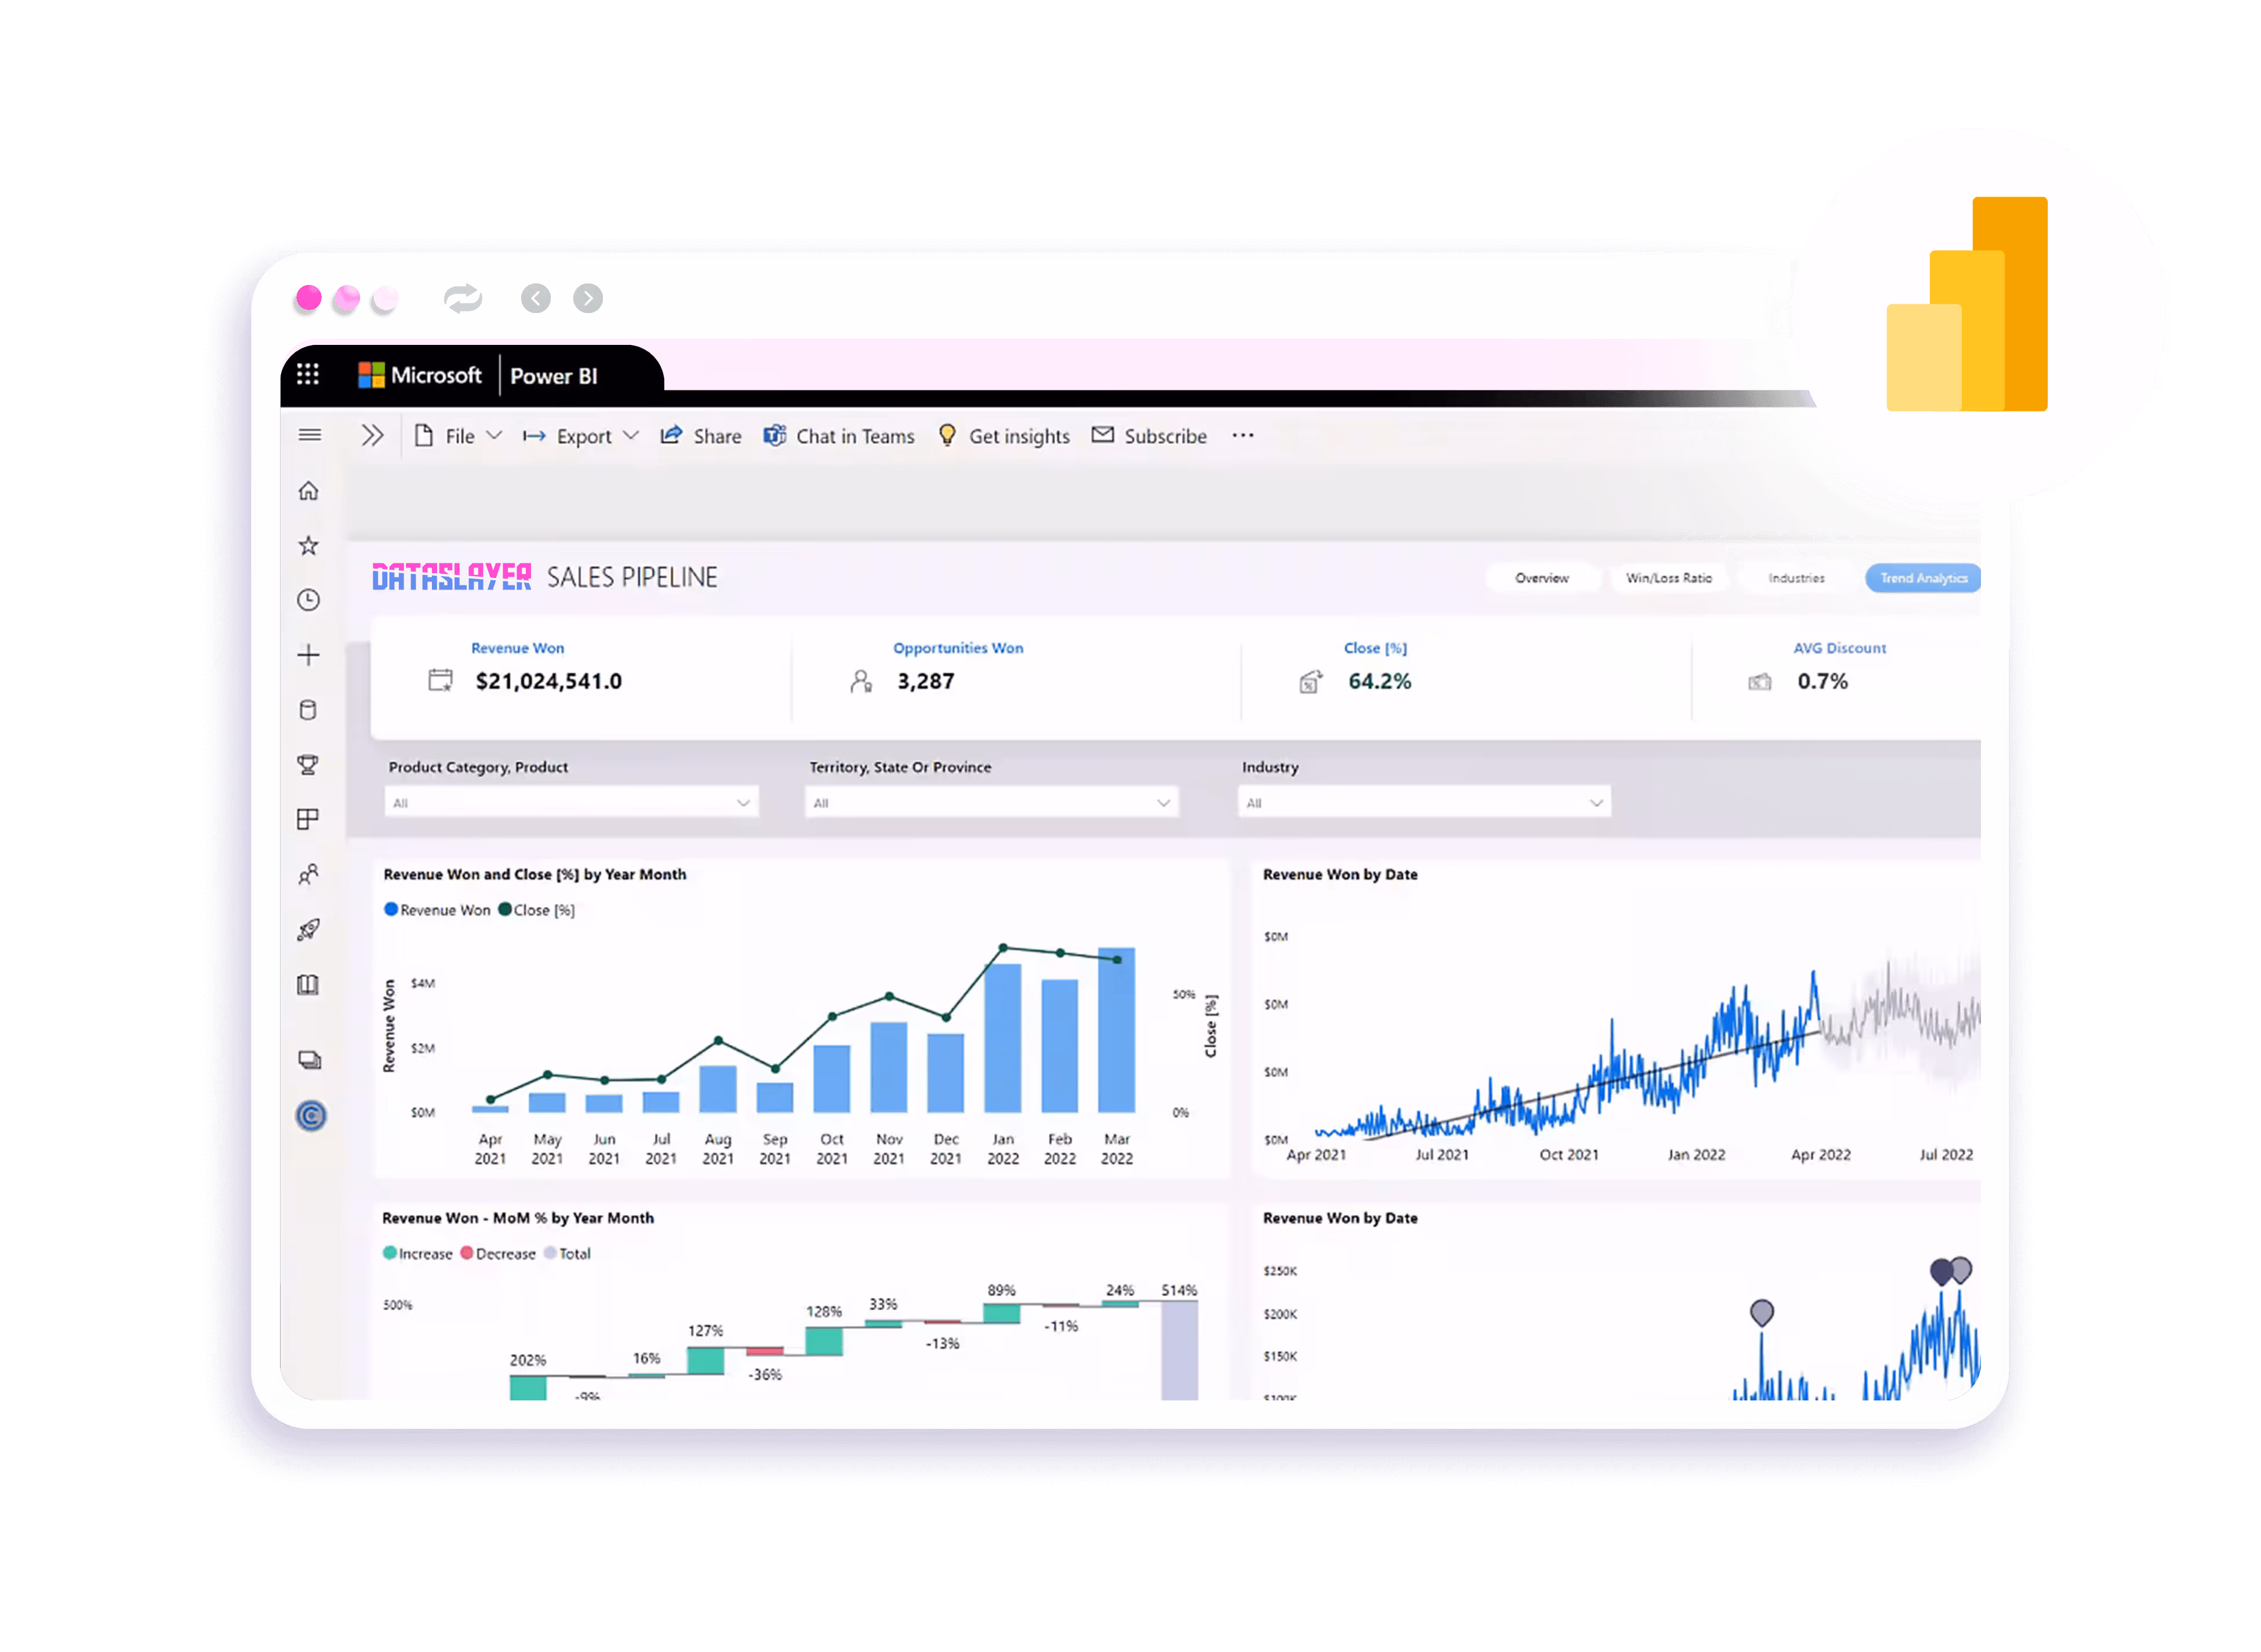
Tool ecosystem selection requires balancing capabilities, cost, and learning curves. Spreadsheet-based reporting using Google Sheets or Microsoft Excel offers universal familiarity and flexibility but demands significant manual effort and lacks sophisticated visualization capabilities. Business intelligence platforms like Looker Studio, Tableau, or Power BI provide powerful visualization and dashboard capabilities but require data integration solutions to populate them efficiently. Data warehouse approaches using platforms like BigQuery, Snowflake, or Redshift offer maximum flexibility and scalability but demand technical expertise most marketing teams lack internally.
The optimal approach for most mid-market organizations combines automated data integration with visualization platforms. This is where platforms like Dataslayer excel by bridging the gap between data sources and reporting destinations. Dataslayer delivers data not only to Google Sheets and Looker Studio but also to data warehouses for organizations requiring more sophisticated analytical capabilities. This flexibility allows marketing teams to start with simpler reporting tools and graduate to more advanced infrastructure as needs grow, without rebuilding their entire data pipeline.
Integration tools handle the technical complexity of API connections, authentication management, and data transformation, delivering clean, ready-to-analyze data to visualization platforms where marketers can build dashboards without programming skills. This division of labor leverages each tool's strengths while remaining accessible to non-technical marketing professionals.
Data quality and governance considerations become increasingly critical as reporting matures. Inconsistent naming conventions, duplicate data sources, incomplete tracking implementation, and conflicting definitions create confusion and undermine confidence in reports. Establishing data governance practices early prevents these issues from compounding over time. Documentation of metric definitions, data source authorities, and calculation methodologies ensures everyone interprets reports consistently. Regular audits identify tracking gaps or data quality issues before they corrupt decision-making.
Modern data integration platforms increasingly include features that support data quality. Dataslayer's approach of maintaining consistent field naming across different marketing platforms helps prevent the confusion that arises when the same metric appears under different names in various source systems. This standardization significantly reduces errors in cross-platform reporting and makes it easier for team members to understand data regardless of which channels they're analyzing.
Interpreting Marketing Reports: From Data to Decisions
Generating marketing reports represents only half the challenge. The true value emerges through skilled interpretation that transforms numbers into insights and insights into actions. This analytical capability distinguishes truly data-driven marketing organizations from those simply going through reporting motions.
Context provides meaning that raw metrics lack. A conversion rate that seems strong in isolation might be concerning when industry benchmarks show competitors achieving significantly higher rates. Traffic growth that appears positive becomes worrisome when conversion rates decline proportionally, indicating quality rather than quantity issues. Seasonal patterns affect interpretation profoundly as many businesses experience predictable cyclical fluctuations throughout the year.
Effective report interpretation always asks what changed and why. When metrics shift significantly, investigators examine concurrent events that might explain the movement. Did you launch new creative assets? Adjust targeting parameters? Change bidding strategies? Experience external factors like competitor activity or seasonal trends? Identifying correlation between actions and outcomes enables teams to replicate successes and avoid repeating mistakes.
Statistical significance matters more than many marketers recognize. Small sample sizes produce unreliable results, yet marketing reports frequently draw conclusions from insufficient data. A campaign that generated three conversions at a cost of fifty dollars each has not demonstrated a sustainable fifty-dollar cost per conversion. The sample size is too small for reliable extrapolation. Understanding confidence intervals and statistical validity prevents premature optimization based on noise rather than signal.
Leading versus lagging indicators serve different analytical purposes. Lagging indicators like revenue, conversions, and ROI reflect past performance definitively but offer limited forward visibility. Leading indicators like impression share trends, engagement rate changes, and traffic growth patterns suggest future direction while outcomes remain uncertain. Skilled analysts monitor both, using leading indicators for early warning systems and course corrections while relying on lagging indicators for definitive performance assessment.
The interpretation process should culminate in explicit recommendations rather than simple data presentation. Reports that conclude with "here's what happened" leave stakeholders wondering what actions to take. Reports that end with "here's what we should do" transform analytics into strategy. These recommendations should be specific, prioritized, and accompanied by expected impact estimates. Rather than suggesting "increase social media budget," specify "reallocate $5,000 monthly from display advertising to LinkedIn advertising based on 3x higher conversion rates observed over the past quarter."
Organizations might benefit from structured analysis frameworks when interpreting reports. The marketing analytics consulting firm Avinash Kaushik's blog popularized the "so what?" test—continually asking what each data point means until reaching actionable insights. Another useful framework examines what happened, why it happened, what will happen, and what we should do about it, systematically working from description through diagnosis to prescription.
Common Mistakes in Marketing Reporting and How to Avoid Them
Despite growing sophistication in marketing analytics, several persistent mistakes continue undermining report effectiveness. Recognizing and addressing these pitfalls dramatically improves reporting value and stakeholder trust.

Vanity metrics plague marketing reports despite widespread recognition of their limitations. Page views, follower counts, impressions, and other volume metrics often dominate reports because they're large numbers that seem impressive. However, these metrics rarely connect directly to business outcomes. A LinkedIn profile gaining ten thousand followers creates no value if none convert to customers or generate pipeline. Report space devoted to vanity metrics would be better spent on conversion rates, customer acquisition costs, or revenue metrics that directly impact business success.
The distinction between activity metrics and outcome metrics helps clarify this issue. Activity metrics measure marketing team effort—emails sent, posts published, ads launched. Outcome metrics measure business results—leads generated, sales closed, revenue produced. While activity metrics provide operational visibility, reports should emphasize outcomes that stakeholders actually care about.
Lack of clear narrative structure transforms potentially valuable reports into confusing data dumps. Reports that simply present numbers without explanation force readers to interpret meaning themselves, often incorrectly. Effective reports tell stories with clear beginnings, middles, and ends. They establish context, present findings, explain implications, and recommend actions. Visual hierarchy guides readers through this narrative, with headings, subheadings, callout boxes, and formatting that emphasizes key points.
Inconsistent reporting standards across time periods, channels, or team members create confusion and prevent meaningful comparison. When metric definitions change, reporting periods shift, or calculation methodologies vary, stakeholders lose confidence in data accuracy. Establishing and documenting reporting standards prevents this erosion of trust. Templates that enforce consistency help maintain standards even as team members change or expand report scope.
This is another area where automated data integration platforms provide substantial value beyond simple time savings. When you manually extract data from different platforms, human error inevitably introduces inconsistencies—perhaps pulling last week's date range from one platform and this week's from another, or using different conversion definitions across channels. Automated systems like Dataslayer apply consistent date ranges, metric definitions, and data transformations across all sources, eliminating these manual inconsistency errors and ensuring apples-to-apples comparisons across channels.
Ignoring negative results represents a particularly damaging mistake that disguises problems until they become crises. Marketing reports sometimes emphasize successes while downplaying or omitting failures. This selective presentation prevents organizations from addressing issues promptly and learning from mistakes. Effective reports present reality honestly, highlighting both what works and what doesn't. This transparency builds credibility and enables faster course correction.
Over-complicated presentations that require extensive effort to comprehend defeat reporting's purpose. Reports filled with jargon, cluttered with unnecessary detail, or lacking clear visual hierarchy frustrate rather than inform stakeholders. The principle of progressive disclosure—presenting high-level insights upfront with supporting detail available for those seeking deeper understanding—improves report usability dramatically. Interactive dashboards excel at this approach, allowing executives to see summaries while specialists can drill into granular data.
Advanced Marketing Reporting Techniques for 2026
As marketing analytics maturity increases, several advanced techniques have emerged that separate leading organizations from the pack. These approaches require more sophisticated infrastructure and analytical capabilities but deliver proportionally greater insights.
Predictive analytics and forecasting shift reporting from describing the past to anticipating the future. Machine learning models analyze historical patterns to project likely outcomes under various scenarios. What conversion rates should we expect next quarter based on seasonal patterns and growth trends? How will changes in ad spend likely impact lead volume? Predictive models answer these forward-looking questions, enabling proactive strategy development rather than reactive response.
Forecasting requires substantial historical data for accuracy, typically at least twelve months and preferably several years. This is where having automated data collection systems proves invaluable—they naturally accumulate the consistent historical datasets that predictive models require. Organizations that have used platforms like Dataslayer for a year or more possess rich historical datasets spanning all their marketing channels, providing the raw material for sophisticated forecasting efforts that manual data collection could never sustainably provide.
Cohort analysis reveals how customer groups acquired at different times perform throughout their lifecycle. Rather than looking at all customers collectively, cohort analysis tracks specific groups separately. Customers acquired in January might behave quite differently from those acquired in June due to seasonal factors, campaign differences, or market conditions. Understanding these variations enables more nuanced retention strategies and more accurate lifetime value projections.
Marketing attribution modeling addresses the fundamental challenge of credit assignment in multi-touch customer journeys. Most customers interact with multiple marketing touchpoints before converting—searching Google, clicking an ad, visiting the website, receiving emails, seeing social media posts. Which touchpoints deserve credit for the eventual conversion? Different attribution models assign credit differently, each with strengths and limitations.
First-touch attribution credits the initial interaction, emphasizing awareness-building activities. Last-touch attribution credits the final interaction before conversion, highlighting closing tactics. Multi-touch models like linear, time-decay, or algorithmic attribution distribute credit across multiple interactions according to various rules. The Google Analytics documentation provides extensive guidance on implementing various attribution models and interpreting their results.
Building effective attribution models requires having complete, integrated data across all customer touchpoints. This represents one of the most compelling use cases for comprehensive data integration. When your Google Ads data, Facebook advertising data, email marketing metrics, and website analytics all flow into a unified reporting environment, you can track customer journeys across channels and properly attribute value to each interaction. Attempting attribution analysis while data remains siloed in individual platform interfaces proves nearly impossible.
Cross-channel journey analysis maps how customers move between marketing touchpoints en route to conversion. These journey maps reveal common patterns, identify bottlenecks where prospects abandon, and highlight particularly effective channel combinations. Organizations might discover that LinkedIn engagement followed by email nurture produces significantly higher conversion rates than other sequences, informing both channel prioritization and orchestration strategy.
Advanced journey analysis requires integrating data across all customer touchpoints and implementing identity resolution to track individuals across devices and platforms. This technical complexity explains why relatively few organizations execute journey analysis comprehensively, but those that do gain substantial competitive advantages through superior understanding of customer behavior.
Incrementality testing and marketing mix modeling attempt to isolate the true causal impact of marketing activities. Correlation does not prove causation—traffic and conversions might increase simultaneously due to external factors rather than marketing effectiveness. Incrementality testing through geo experiments, holdout groups, or matched market tests establishes what would have happened without marketing investment, revealing true incremental impact rather than correlated movement.
These advanced techniques require specialized expertise and significant data volumes but provide substantially more accurate assessments of marketing effectiveness than simpler correlation-based analyses can achieve.
Practical Steps to Improve Your Marketing Reports Today
While advanced techniques and sophisticated infrastructure represent aspirational goals, most organizations can significantly improve their marketing reports through practical steps implementable immediately.
Start with stakeholder interviews to understand what information different audiences actually need. Rather than assuming what executives, managers, or specialists want to see, ask them directly. What questions do they need answered? What decisions do reports inform? What format would be most useful? This discovery process often reveals that current reports miss critical information while including irrelevant detail.
Audit your current data sources to identify gaps, redundancies, and quality issues. Document which platforms you use, what data they contain, how you currently access that data, and where problems exist. This inventory provides the foundation for improvement planning. You might discover that some data remains entirely unused because accessing it proves too cumbersome, or that teams waste time reconciling conflicting numbers from overlapping sources.
Implement a data integration solution to automate the mechanical aspects of report generation. For most mid-market organizations, this represents the single highest-impact improvement possible. The time savings alone justify the investment, but the consistency, reliability, and expanded analytical possibilities provide even greater value. Platforms like Dataslayer offer straightforward implementations that connect marketing platforms to Google Sheets, Looker Studio, or data warehouses within days rather than months, making sophisticated reporting accessible even to organizations without extensive technical resources.
Create report templates that enforce consistency while allowing necessary customization. These templates should specify which metrics appear in which sections, how date ranges are defined, what visualizations are used, and how findings are presented. Templates dramatically reduce the time required to generate recurring reports while improving quality and consistency.
Establish a regular review calendar that creates recurring forums where reports drive discussions and decisions. Monthly business reviews, weekly optimization sessions, and quarterly strategic planning cycles should all include dedicated time for reviewing relevant marketing reports. Scheduling these reviews in advance ensures reports inform decisions rather than being generated but never acted upon.
Invest in training to build analytical literacy across your marketing team. Even the best reports provide little value if readers lack the skills to interpret them correctly. Training should cover fundamental concepts like statistical significance, correlation versus causation, and metric definitions, alongside practical instruction in using your specific reporting tools. Many organizations find that brief lunch-and-learn sessions covering one concept monthly work well for building analytical capabilities without overwhelming team members.
Iterate based on feedback by regularly asking report consumers whether they find reports useful and what could improve. This feedback loop ensures reporting practices evolve with changing needs rather than becoming stagnant. Small adjustments based on user feedback often yield substantial improvements in report effectiveness.
The Future of Marketing Reports: AI, Automation, and Integration
The trajectory of marketing reporting points clearly toward greater automation, more sophisticated analysis, and tighter integration with execution platforms. Several emerging trends will reshape how organizations approach marketing analytics in the coming years.
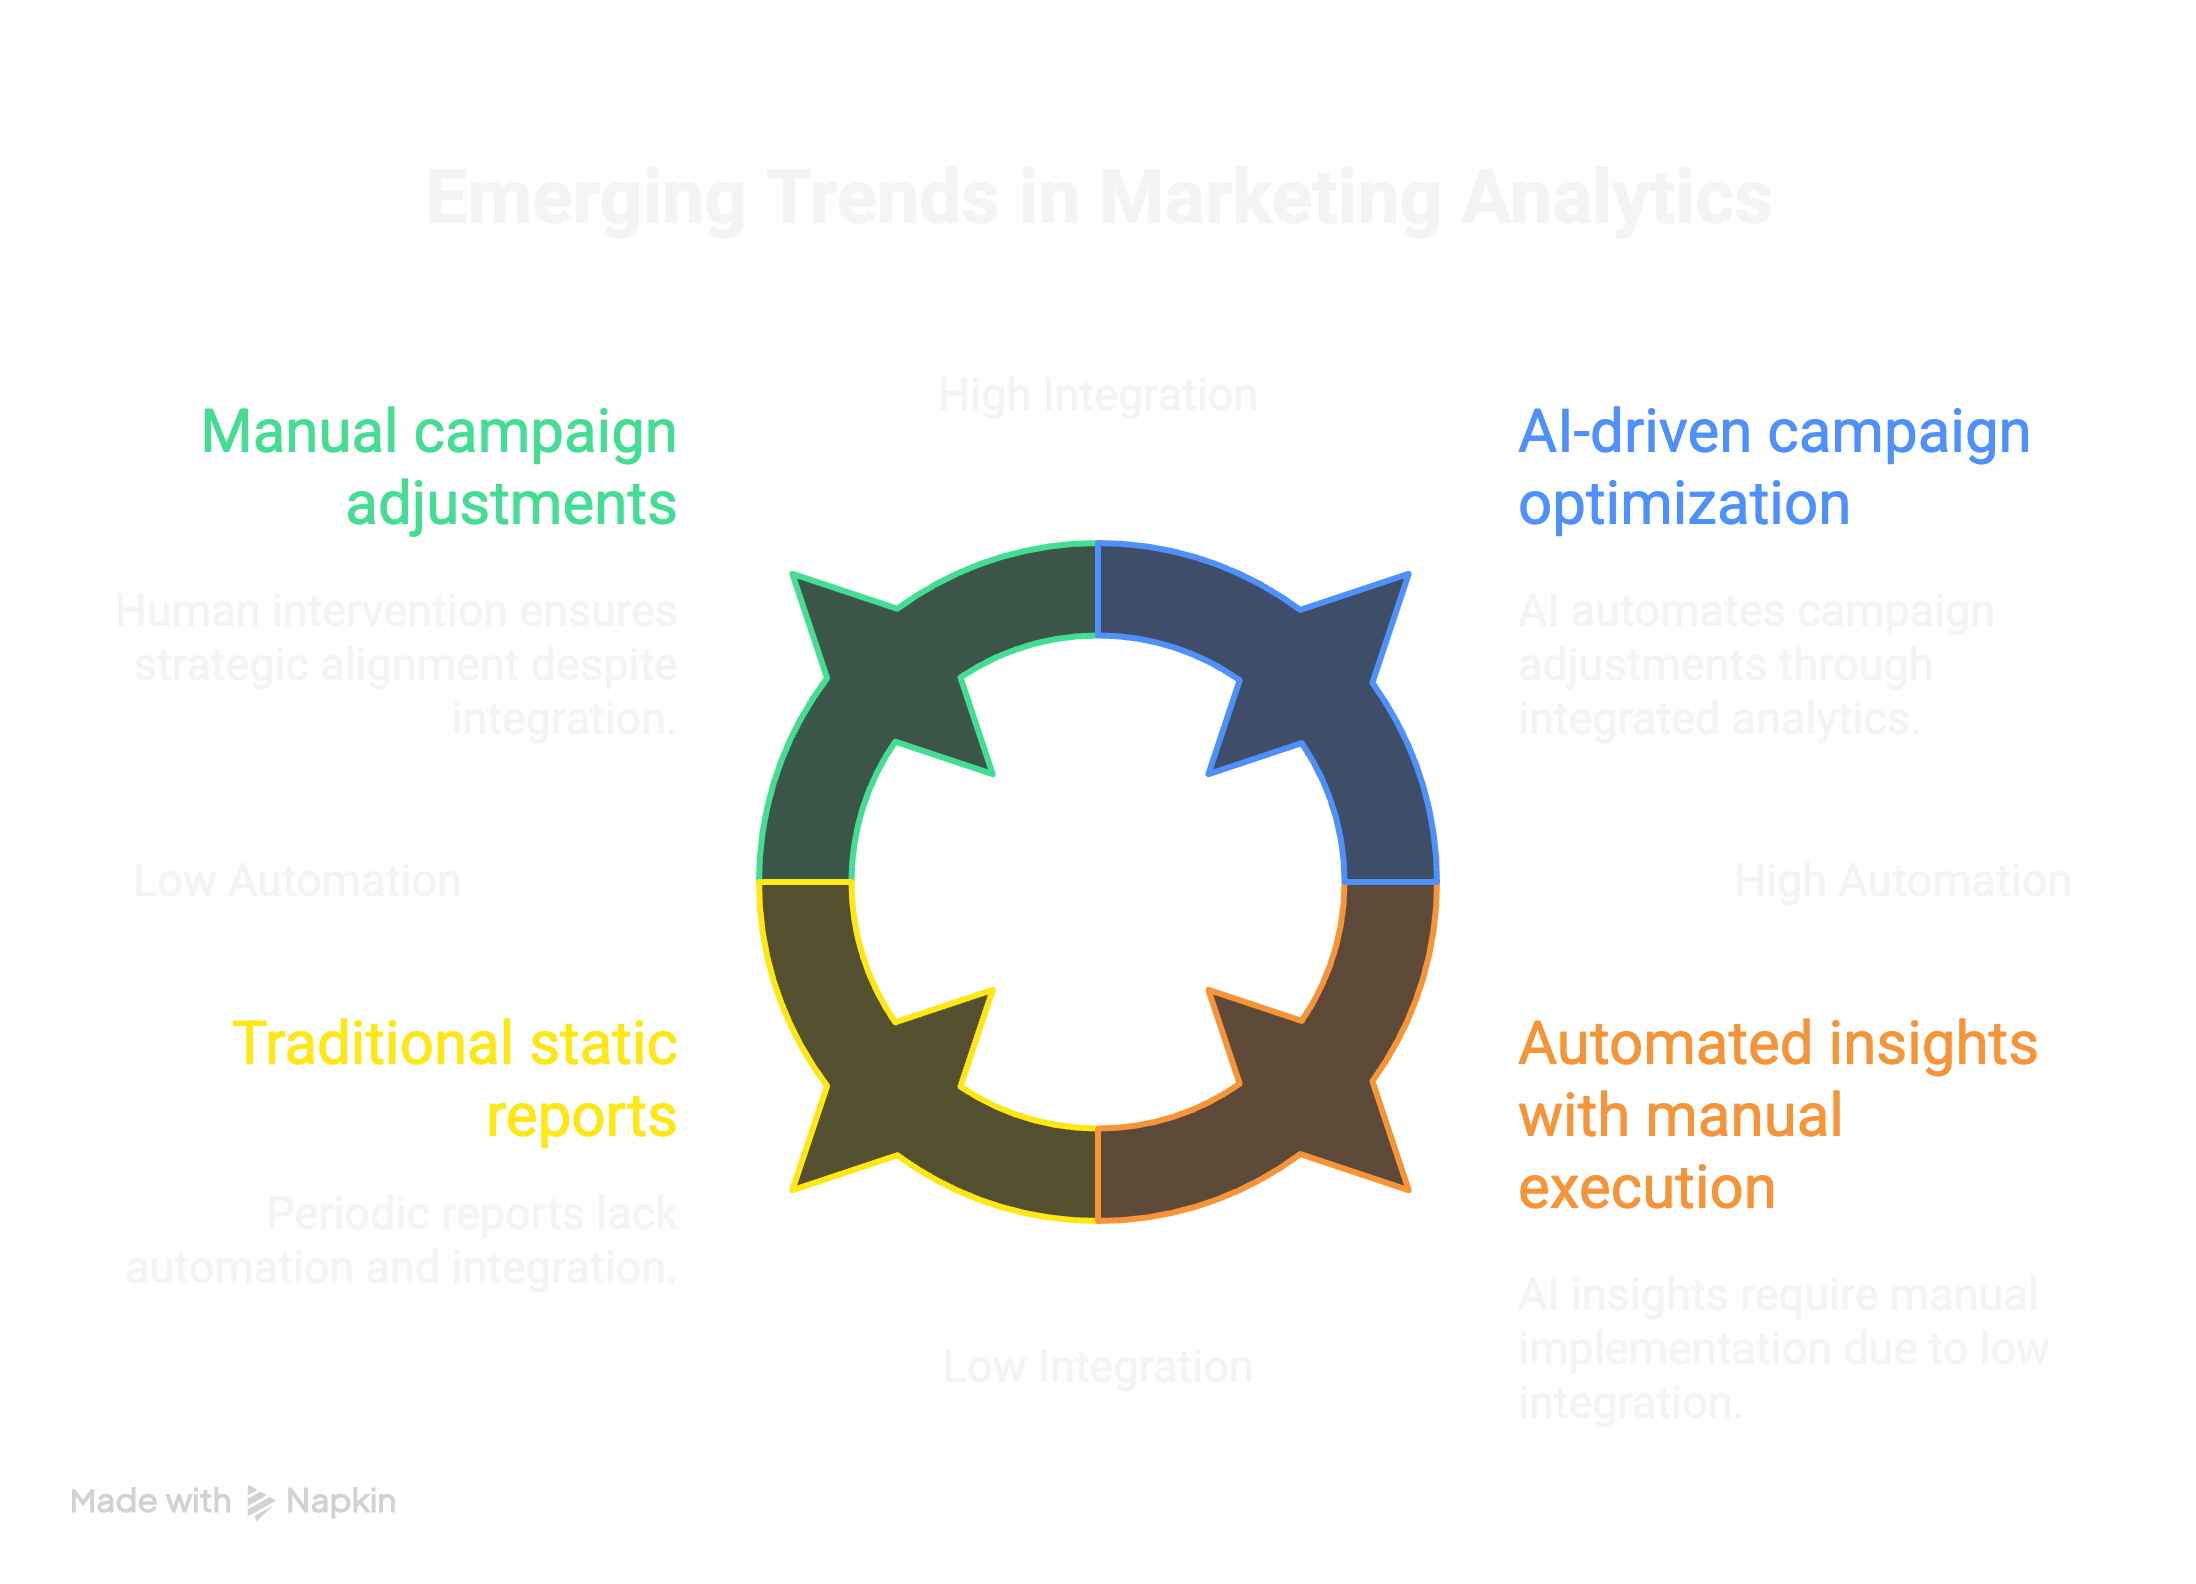
Artificial intelligence is transforming report generation from manual processes to automated insights. AI-powered analytics platforms analyze data continuously, identifying significant patterns, anomalies, and opportunities without human prompting. Rather than marketers searching for insights in data, AI surfaces noteworthy findings automatically. Natural language generation creates written summaries of key findings, potentially eliminating the need for humans to write executive summaries or interpret basic performance patterns.
These AI capabilities exist today in platforms like Google Analytics 4, which includes automated insights, and are expanding rapidly across the analytics ecosystem. However, AI augments rather than replaces human analytical judgment. Strategic interpretation, creative response to findings, and integration with broader business context still require human intelligence.
Real-time reporting continues displacing periodic static reports for many use cases. Traditional reports generated weekly or monthly provided retrospective views that sometimes felt outdated by the time stakeholders reviewed them. Continuously updated dashboards provide current information without waiting for scheduled report cycles. This immediacy enables faster response to problems and opportunities, though it requires discipline to avoid over-reacting to short-term fluctuations.
The balance between real-time monitoring and periodic deep analysis varies by metric and situation. Brand metrics and strategic initiatives warrant periodic review while campaign performance during active runs benefits from real-time visibility. Sophisticated organizations maintain both real-time operational dashboards and periodic strategic reports, using each where appropriate.
Integration between analytics and activation platforms is tightening, reducing friction between insight and action. Rather than discovering opportunities in reports then manually implementing changes across campaign platforms, emerging systems enable direct adjustment from analytics interfaces. This integration accelerates the insight-to-action cycle and reduces execution errors that occur during manual translation of analytical findings into platform-specific implementations.
The data integration platforms that currently focus on pulling data from marketing platforms into reporting destinations are evolving to support bidirectional flows, enabling not just reporting but also automated campaign optimization based on analytical insights. This convergence between analytics and activation represents the next frontier in marketing technology integration.
Privacy-first analytics represents a fundamental shift reshaping how marketing data collection and reporting function. Regulations like GDPR in Europe and various state-level privacy laws in the United States restrict data collection and usage. Browser changes eliminating third-party cookies and platform restrictions on data sharing further constrain traditional tracking methodologies. Marketing reports must adapt to this privacy-first environment, potentially relying more on aggregated trends and modeled data rather than granular individual-level tracking.
This evolution toward privacy-conscious analytics doesn't eliminate the possibility of effective reporting, but it does require different approaches and potentially accepting less granular detail than previously available. First-party data collection, with proper consent mechanisms, becomes increasingly valuable as third-party tracking diminishes. Organizations serious about data security should prioritize integration platforms with robust compliance certifications to ensure their reporting infrastructure meets evolving regulatory requirements.
Building a Data-Driven Marketing Culture Through Effective Reporting
Beyond technical capabilities and analytical sophistication, the ultimate goal of marketing reports is fostering organizational cultures where data informs every significant decision. This transformation requires more than tools and metrics—it demands changes in processes, incentives, and mindsets.
Regular review cadences establish rhythms where teams consistently examine performance and adjust strategies. Monthly business reviews, weekly campaign optimization sessions, and quarterly strategic planning cycles create recurring forums where marketing reports drive discussions. These structured reviews prevent reports from being generated but not acted upon, a common failure mode that undermines reporting value.
Democratizing data access empowers team members at all levels to answer their own questions rather than relying entirely on centralized analytics teams. Self-service reporting capabilities, when implemented thoughtfully, accelerate insight discovery and reduce bottlenecks. However, democratization requires careful balance—providing access without adequate training or governance can lead to misinterpretation and inconsistent analyses. Progressive access models that expand permissions as users demonstrate analytical competence often work well.
Modern data integration platforms support this democratization by making data accessible without requiring users to understand API authentication, query languages, or data transformation logic. A marketing coordinator who needs to check yesterday's Facebook Ads performance can access current data in familiar formats like Google Sheets or Looker Studio without involving technical specialists or waiting for scheduled reports.
Tying reports to accountability ensures findings translate into actions. When reports reveal underperforming campaigns or missed targets, clear ownership for addressing issues must exist. Conversely, when reports demonstrate success, recognition and resource allocation should follow. This accountability loop transforms reporting from academic exercise into operational necessity that drives behavior change.
Continuous improvement in reporting practice itself represents an often-overlooked opportunity. Marketing reports should evolve based on user feedback, changing business needs, and improved capabilities. Regular meta-reviews that ask whether reports are actually useful, whether they reach the right audiences, and whether they drive decisions help refine reporting practices over time. What worked last year may no longer serve current needs as organizations grow, strategies shift, or capabilities expand.
Conclusion: The Strategic Imperative of Effective Marketing Reports
Marketing reports in 2026 have evolved from nice-to-have documentation into strategic necessities that separate successful organizations from those struggling to demonstrate value and optimize performance. The complexity of modern marketing ecosystems, the proliferation of data sources, and the increasing sophistication of analytical techniques have raised the stakes considerably. Organizations that excel at marketing reporting gain significant competitive advantages through superior understanding of customer behavior, more efficient resource allocation, and faster response to opportunities and threats.
Building effective marketing reporting practices requires attention to multiple dimensions simultaneously. The technical infrastructure must reliably consolidate data from diverse sources while maintaining accuracy and freshness. Solutions like Dataslayer have become foundational infrastructure for this purpose, providing the automated data integration that makes comprehensive, consistent reporting feasible without consuming endless analyst time on manual data gathering. The analytical framework must balance comprehensiveness with focus, tracking metrics that genuinely matter while avoiding distraction from vanity metrics. The presentation layer must communicate clearly to diverse stakeholders, from executives requiring strategic summaries to specialists needing operational detail. The organizational processes must ensure reports drive decisions rather than simply documenting history.
The investment required to build sophisticated reporting capabilities pays dividends through improved marketing effectiveness, stronger stakeholder confidence, and more strategic resource allocation. As marketing continues its evolution toward data-driven decision making, the organizations that master reporting and analytics will increasingly outperform those still relying on intuition and limited visibility into performance drivers.
Whether you're building reporting capabilities from scratch or refining existing practices, focusing on stakeholder needs, maintaining data quality, automating mechanical processes, and fostering analytical cultures creates foundations for long-term success. The future of marketing belongs to organizations that can transform the flood of available data into clear insights and confident decisions—and that transformation begins with effective marketing reports backed by robust data integration infrastructure that makes comprehensive analytics accessible to every team member who needs it.


