ATLAS
Your entire data stack,
replaced by one intelligent platform.
Dataslayer Atlas unifies every data source into your own data warehouse, turns it into interactive dashboards in seconds, and puts an AI analyst to work surfacing the signals that grow revenue. No BigQuery bill, no Tableau licenses, no hundreds of hours lost to manual reporting.
Request early access
See how it works
One platform for every data source
Built on Dataslayer's 60+ connectors, databases and warehouses
ATLAS
Your entire data stack,
replaced by one intelligent platform.
Dataslayer Atlas unifies every data source into your own data warehouse, turns it into interactive dashboards in seconds, and puts an AI analyst to work surfacing the signals that grow revenue. No BigQuery bill, no Tableau licenses, no hundreds of hours lost to manual reporting.
Request early access
See how it works
One platform for every data source
Built on Dataslayer's 60+ connectors, databases and warehouses
The status quo is broken
The modern data stack is
held together with duct tape
To answer one question about performance, you're paying for three separate things, and waiting on a fourth.
Cost #1
Storage
Thousands for an external warehouse.
You pay BigQuery, Snowflake or Amazon Redshift thousands of euros a year just to store the data your business already generates.
Cost #2
Licenses
Thousands more for BI seats.
Then you pay again for Tableau and Power BI licenses, just to turn that stored data into a chart someone can read. And the "free" route (Looker Studio) still costs you in manual dashboard building and connector fees.
Cost #3
Hours
Hundreds of analyst hours.
Your best analysts burn their week on imports, data modeling, dashboard building and storytelling, before a single decision gets made.
The result: slow, expensive, and by the time the insight lands,
the moment has already passed.
The status quo is broken
The modern data stack is
held together with duct tape
To answer one question about performance, you're paying for three separate things, and waiting on a fourth.
Cost #1
Storage
Thousands for an external warehouse.
You pay BigQuery, Snowflake or Amazon Redshift thousands of euros a year just to store the data your business already generates.
Cost #2
Licenses
Thousands more for BI seats.
Then you pay again for Tableau and Power BI licenses, just to turn that stored data into a chart someone can read. And the "free" route (Looker Studio) still costs you in manual dashboard building and connector fees.
Cost #3
Hours
Hundreds of analyst hours.
Your best analysts burn their week on imports, data modeling, dashboard building and storytelling, before a single decision gets made.
The result: slow, expensive, and by the time the insight lands,
the moment has already passed.
How Atlas works
One platform that
closes the loop
Scattered data goes in. Strategic decisions come out. And every cycle makes the next one sharper.
ETL
Every connector is extracted, transformed and loaded into your own secure, reliable data warehouse: one source of truth, fully moldable with SQL.
Visualize
Turn it into interactive dashboards, built by hand or generated by AI. Download, share and modify them freely.
Discover
The AI reads your data and surfaces the signals: what to scale, what to fix, and what's just noise.
Learn
Those signals feed back into the model. The system keeps learning, so your intelligence compounds over time.
The circle closes: data becomes dashboards, dashboards become signals, and signals become
self-learning intelligence.
How Atlas works
One platform that
closes the loop
Scattered data goes in. Strategic decisions come out. And every cycle makes the next one sharper.
ETL
Every connector is extracted, transformed and loaded into your own secure, reliable data warehouse: one source of truth, fully moldable with SQL.
Visualize
Turn it into interactive dashboards, built by hand or generated by AI. Download, share and modify them freely.
Discover
The AI reads your data and surfaces the signals: what to scale, what to fix, and what's just noise.
Learn
Those signals feed back into the model. The system keeps learning, so your intelligence compounds over time.
The circle closes: data becomes dashboards, dashboards become signals, and signals become
self-learning intelligence.
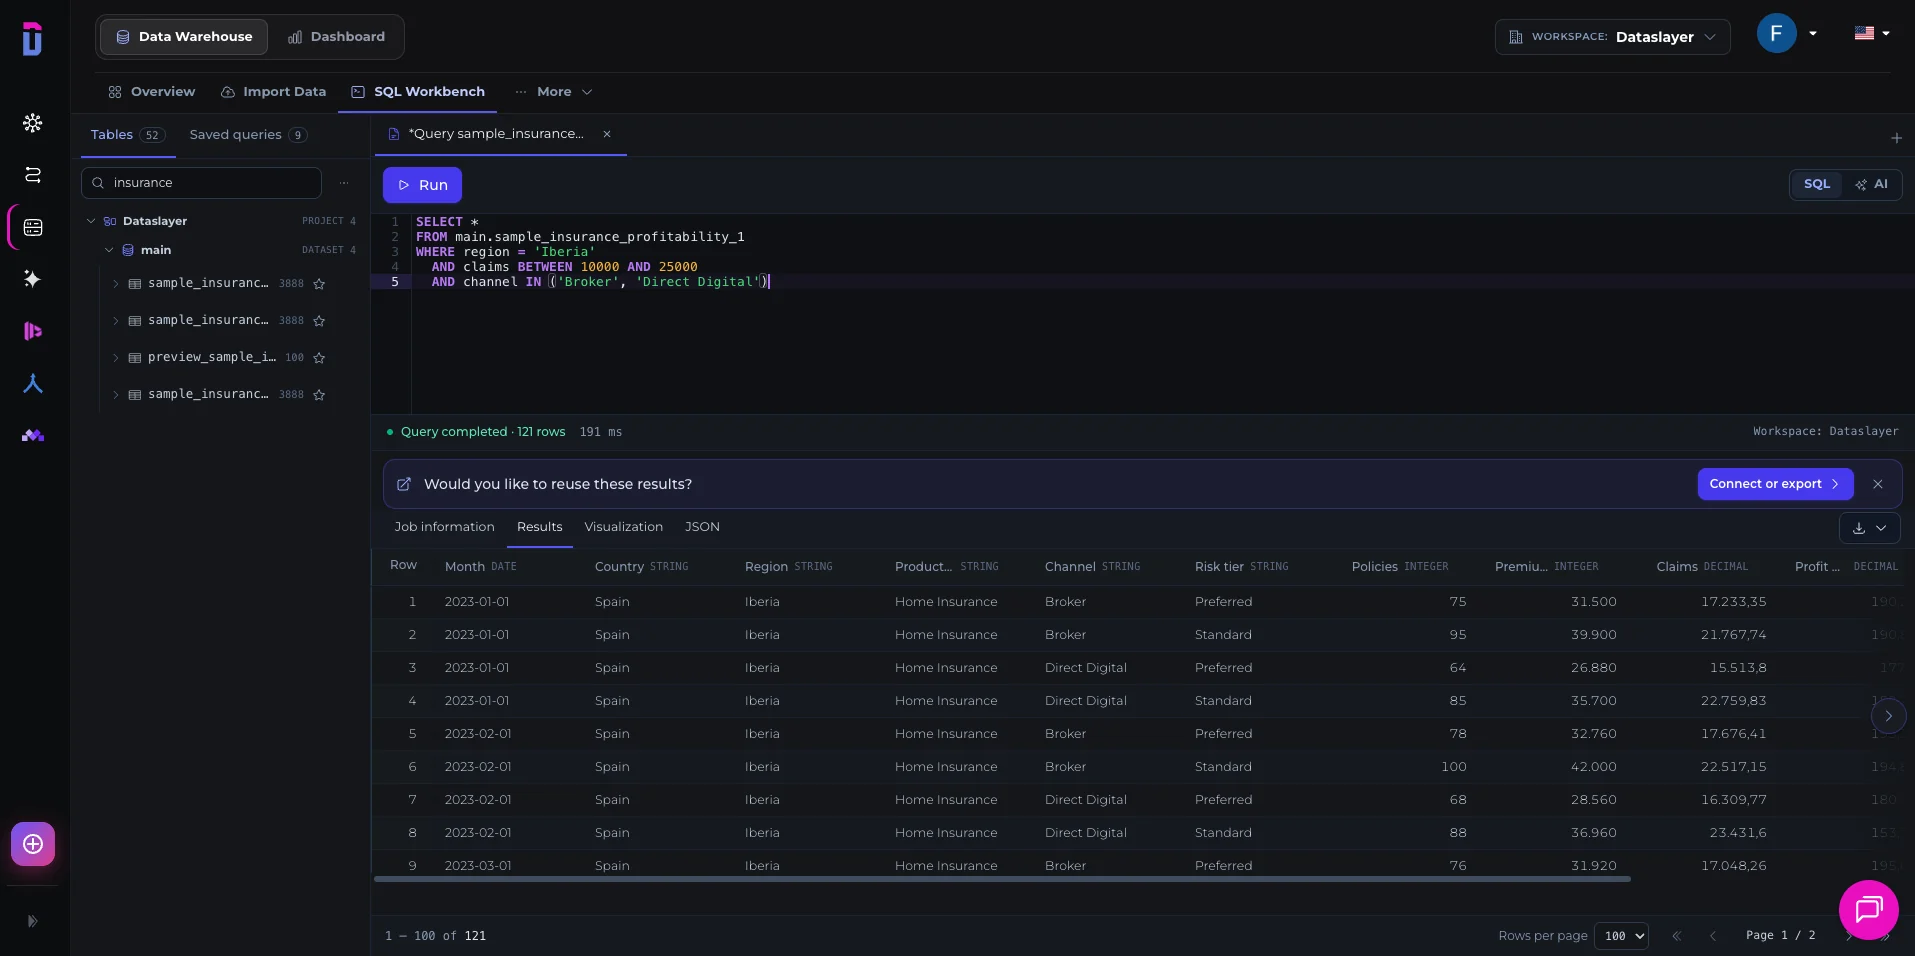
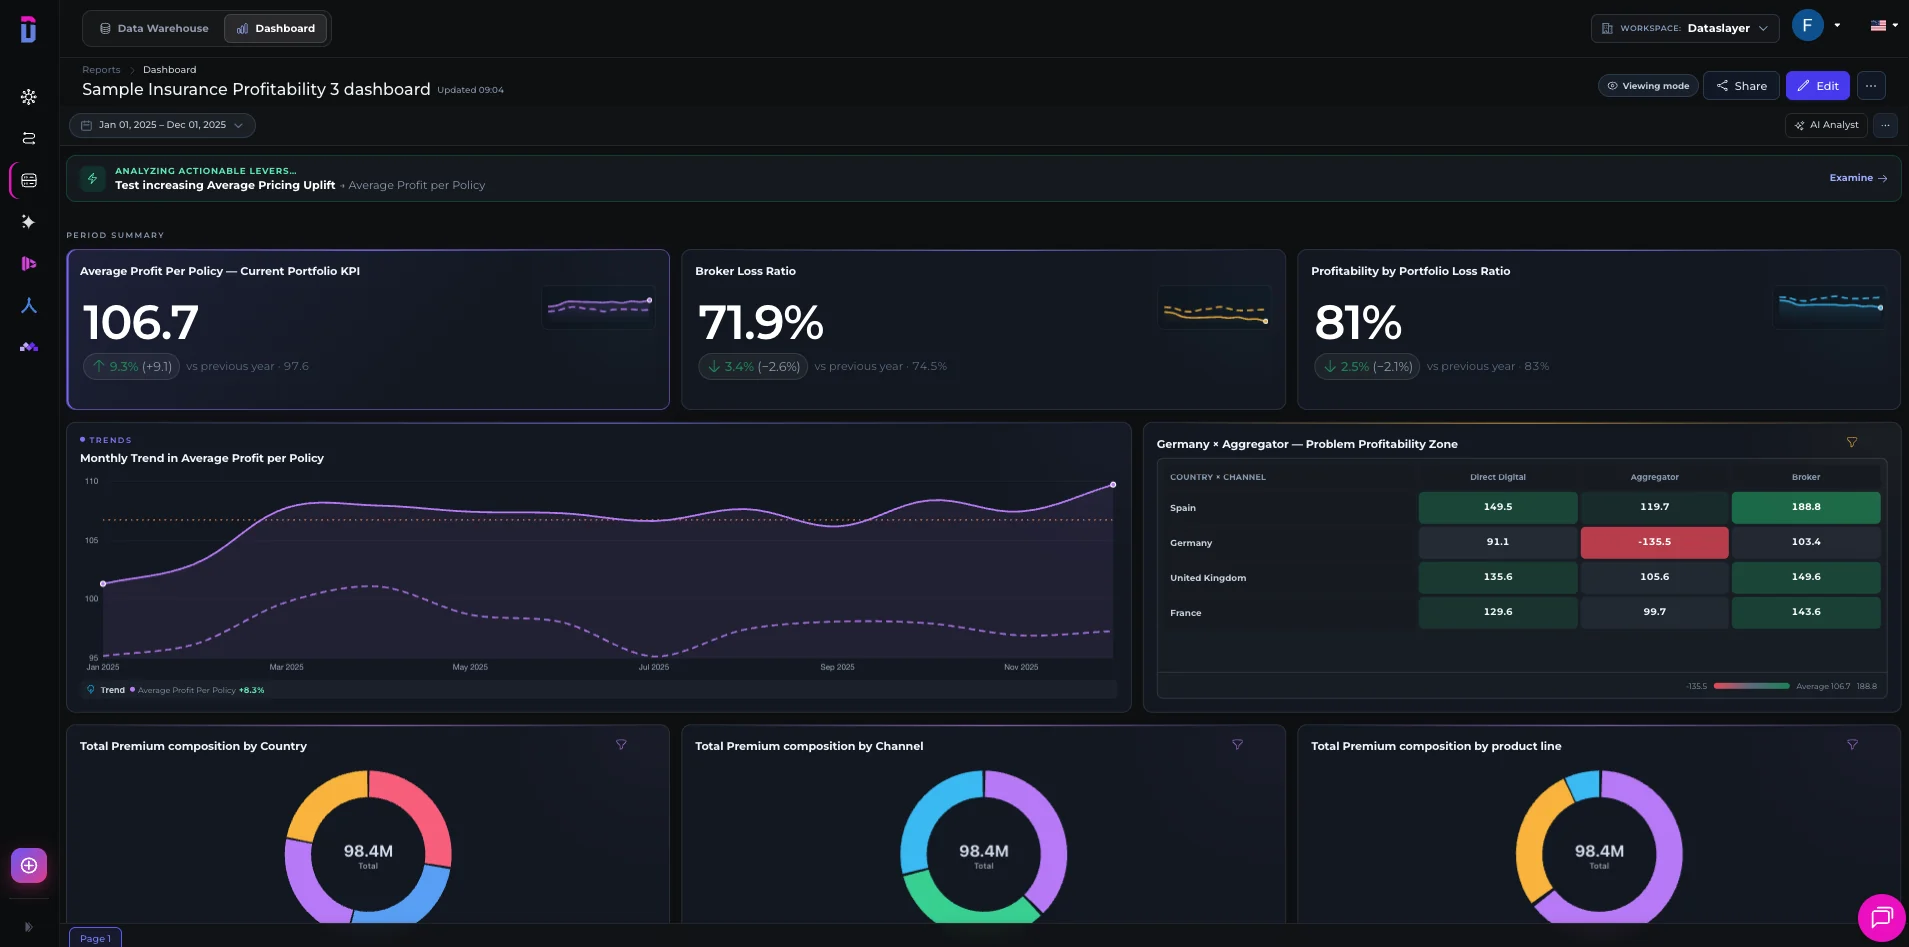
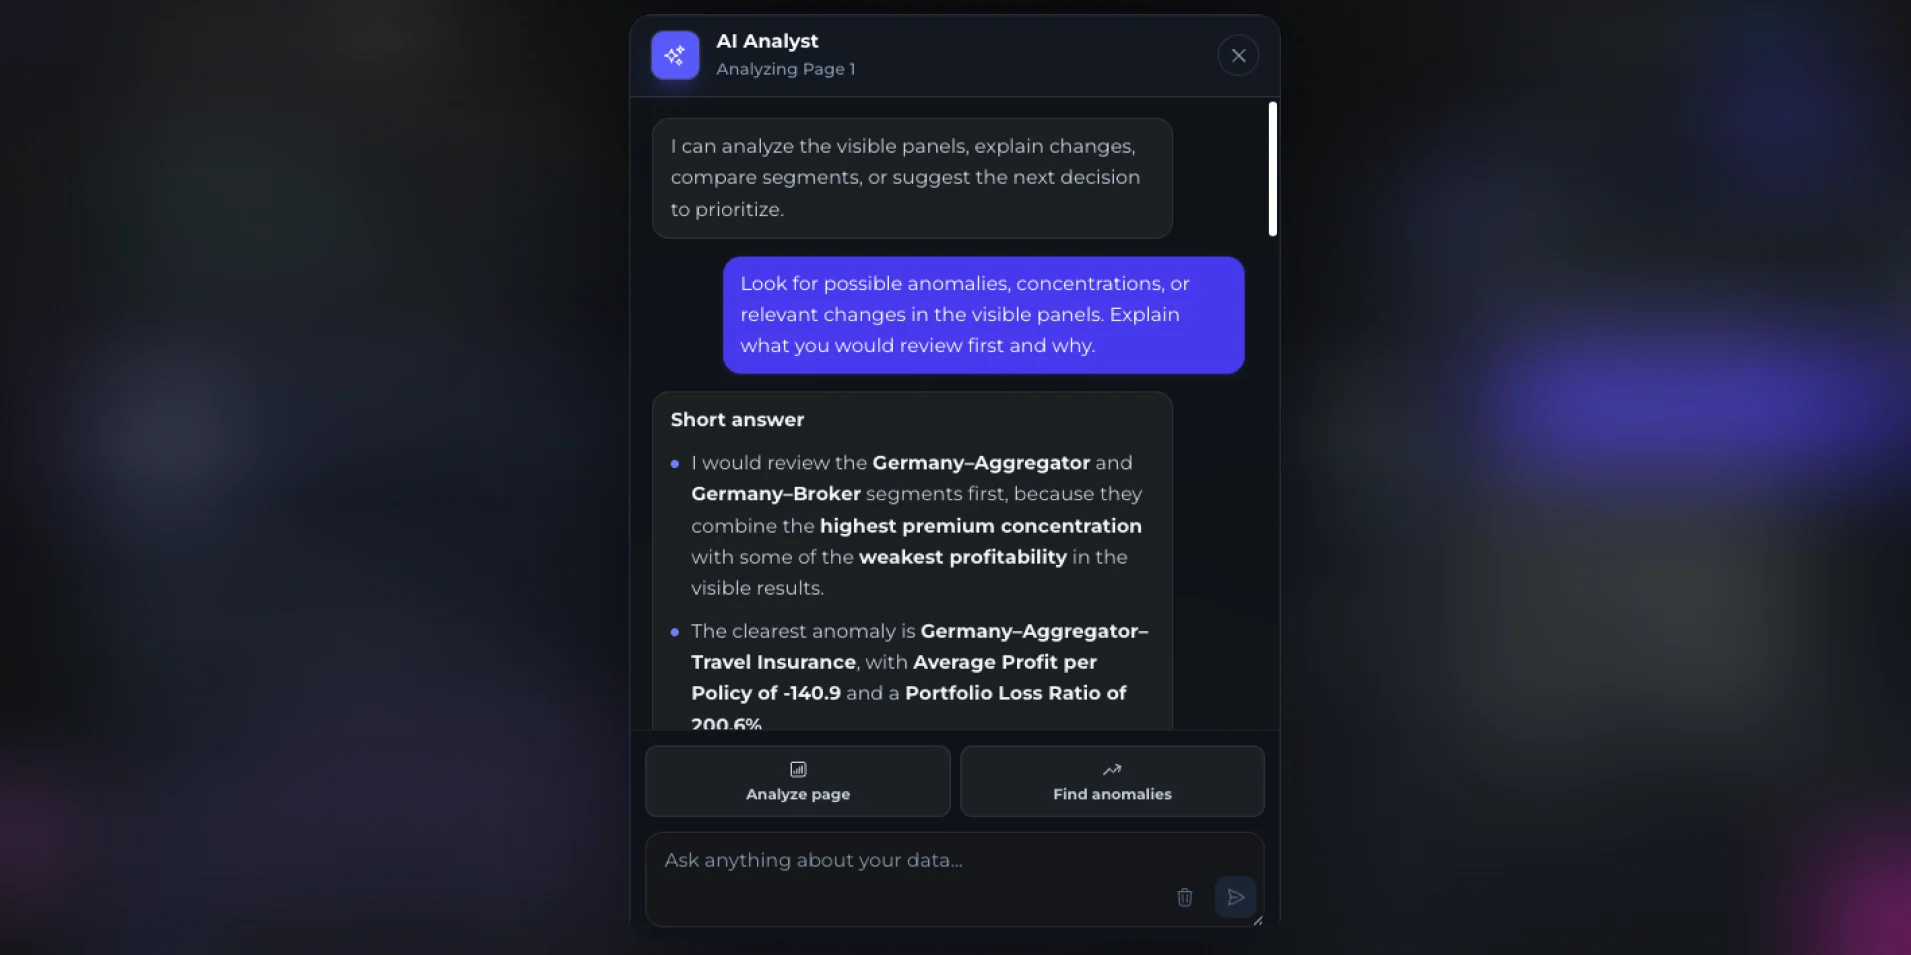
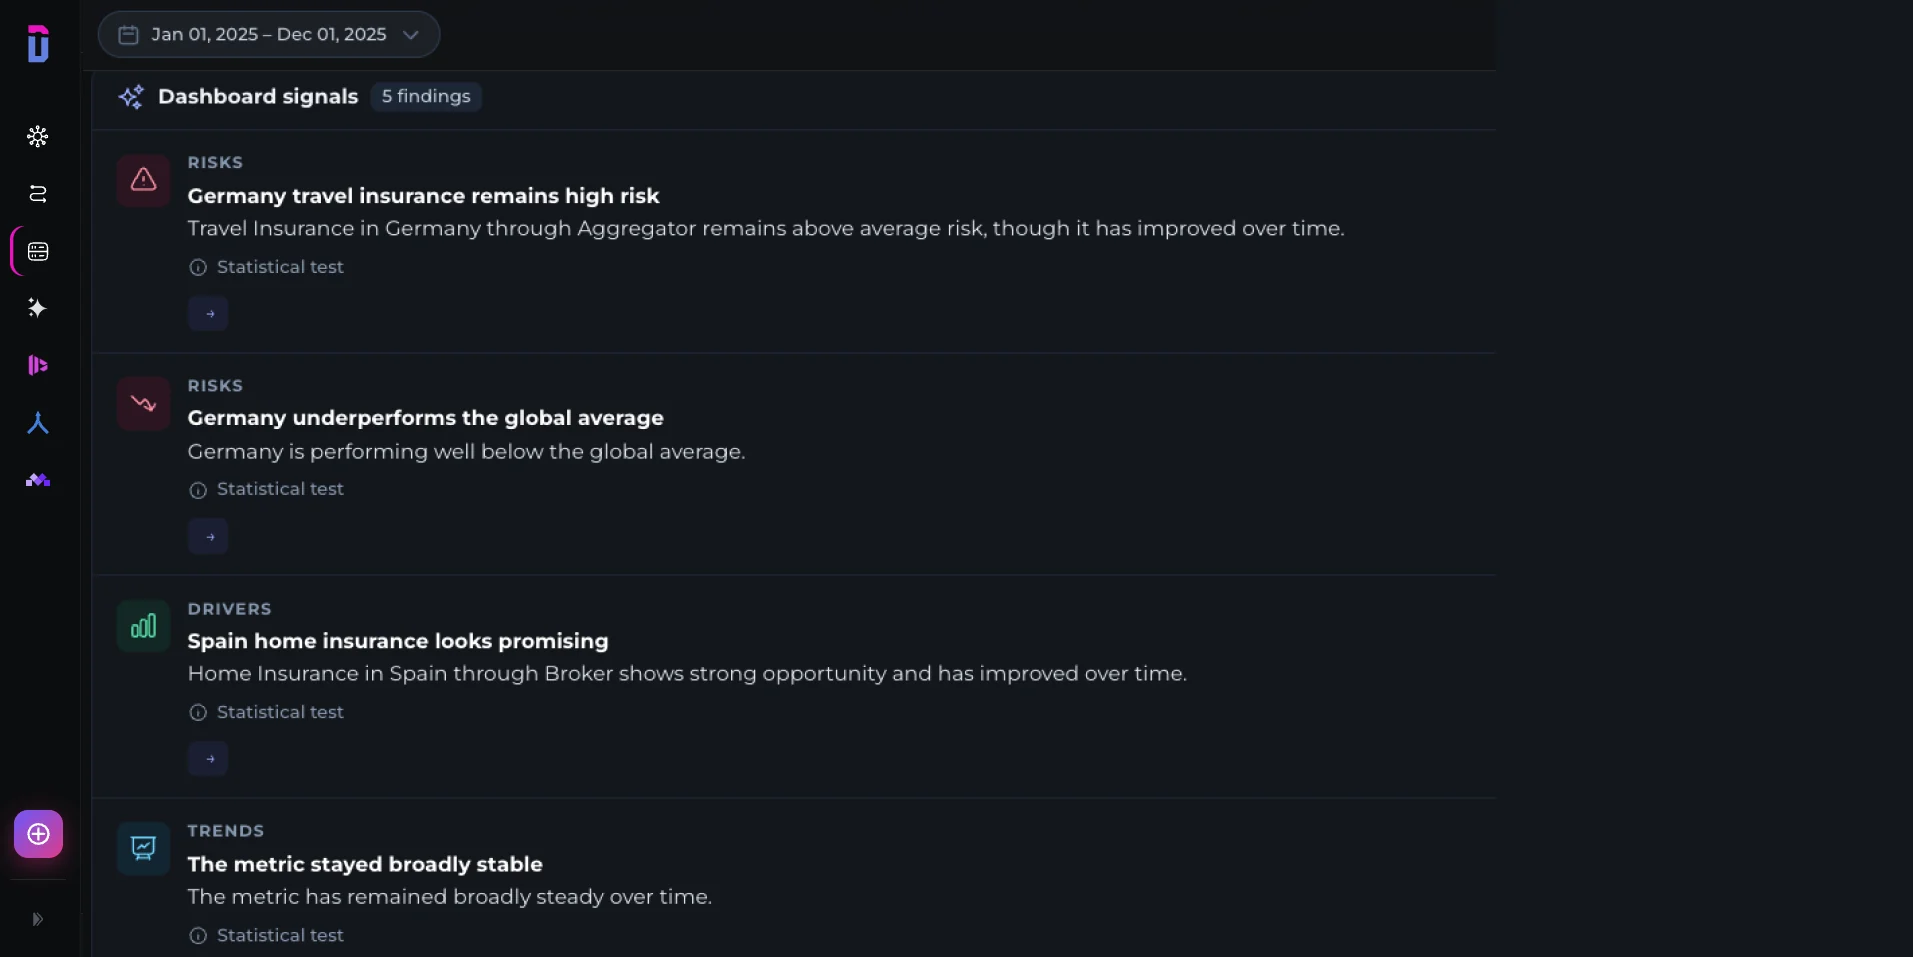
Atlas: SQL Workbench ejecutando una consultaAtlas: dashboard con KPIs y tendenciasAtlas: AI Analyst respondiendo sobre los panelesAtlas: panel de senales con riesgos y drivers
Three products. One platform.
Everything you were stitching together,
now native
Atlas replaces your warehouse, your BI tool and your reporting workflow with one platform for all your business data.
Replaces
Your own data warehouse
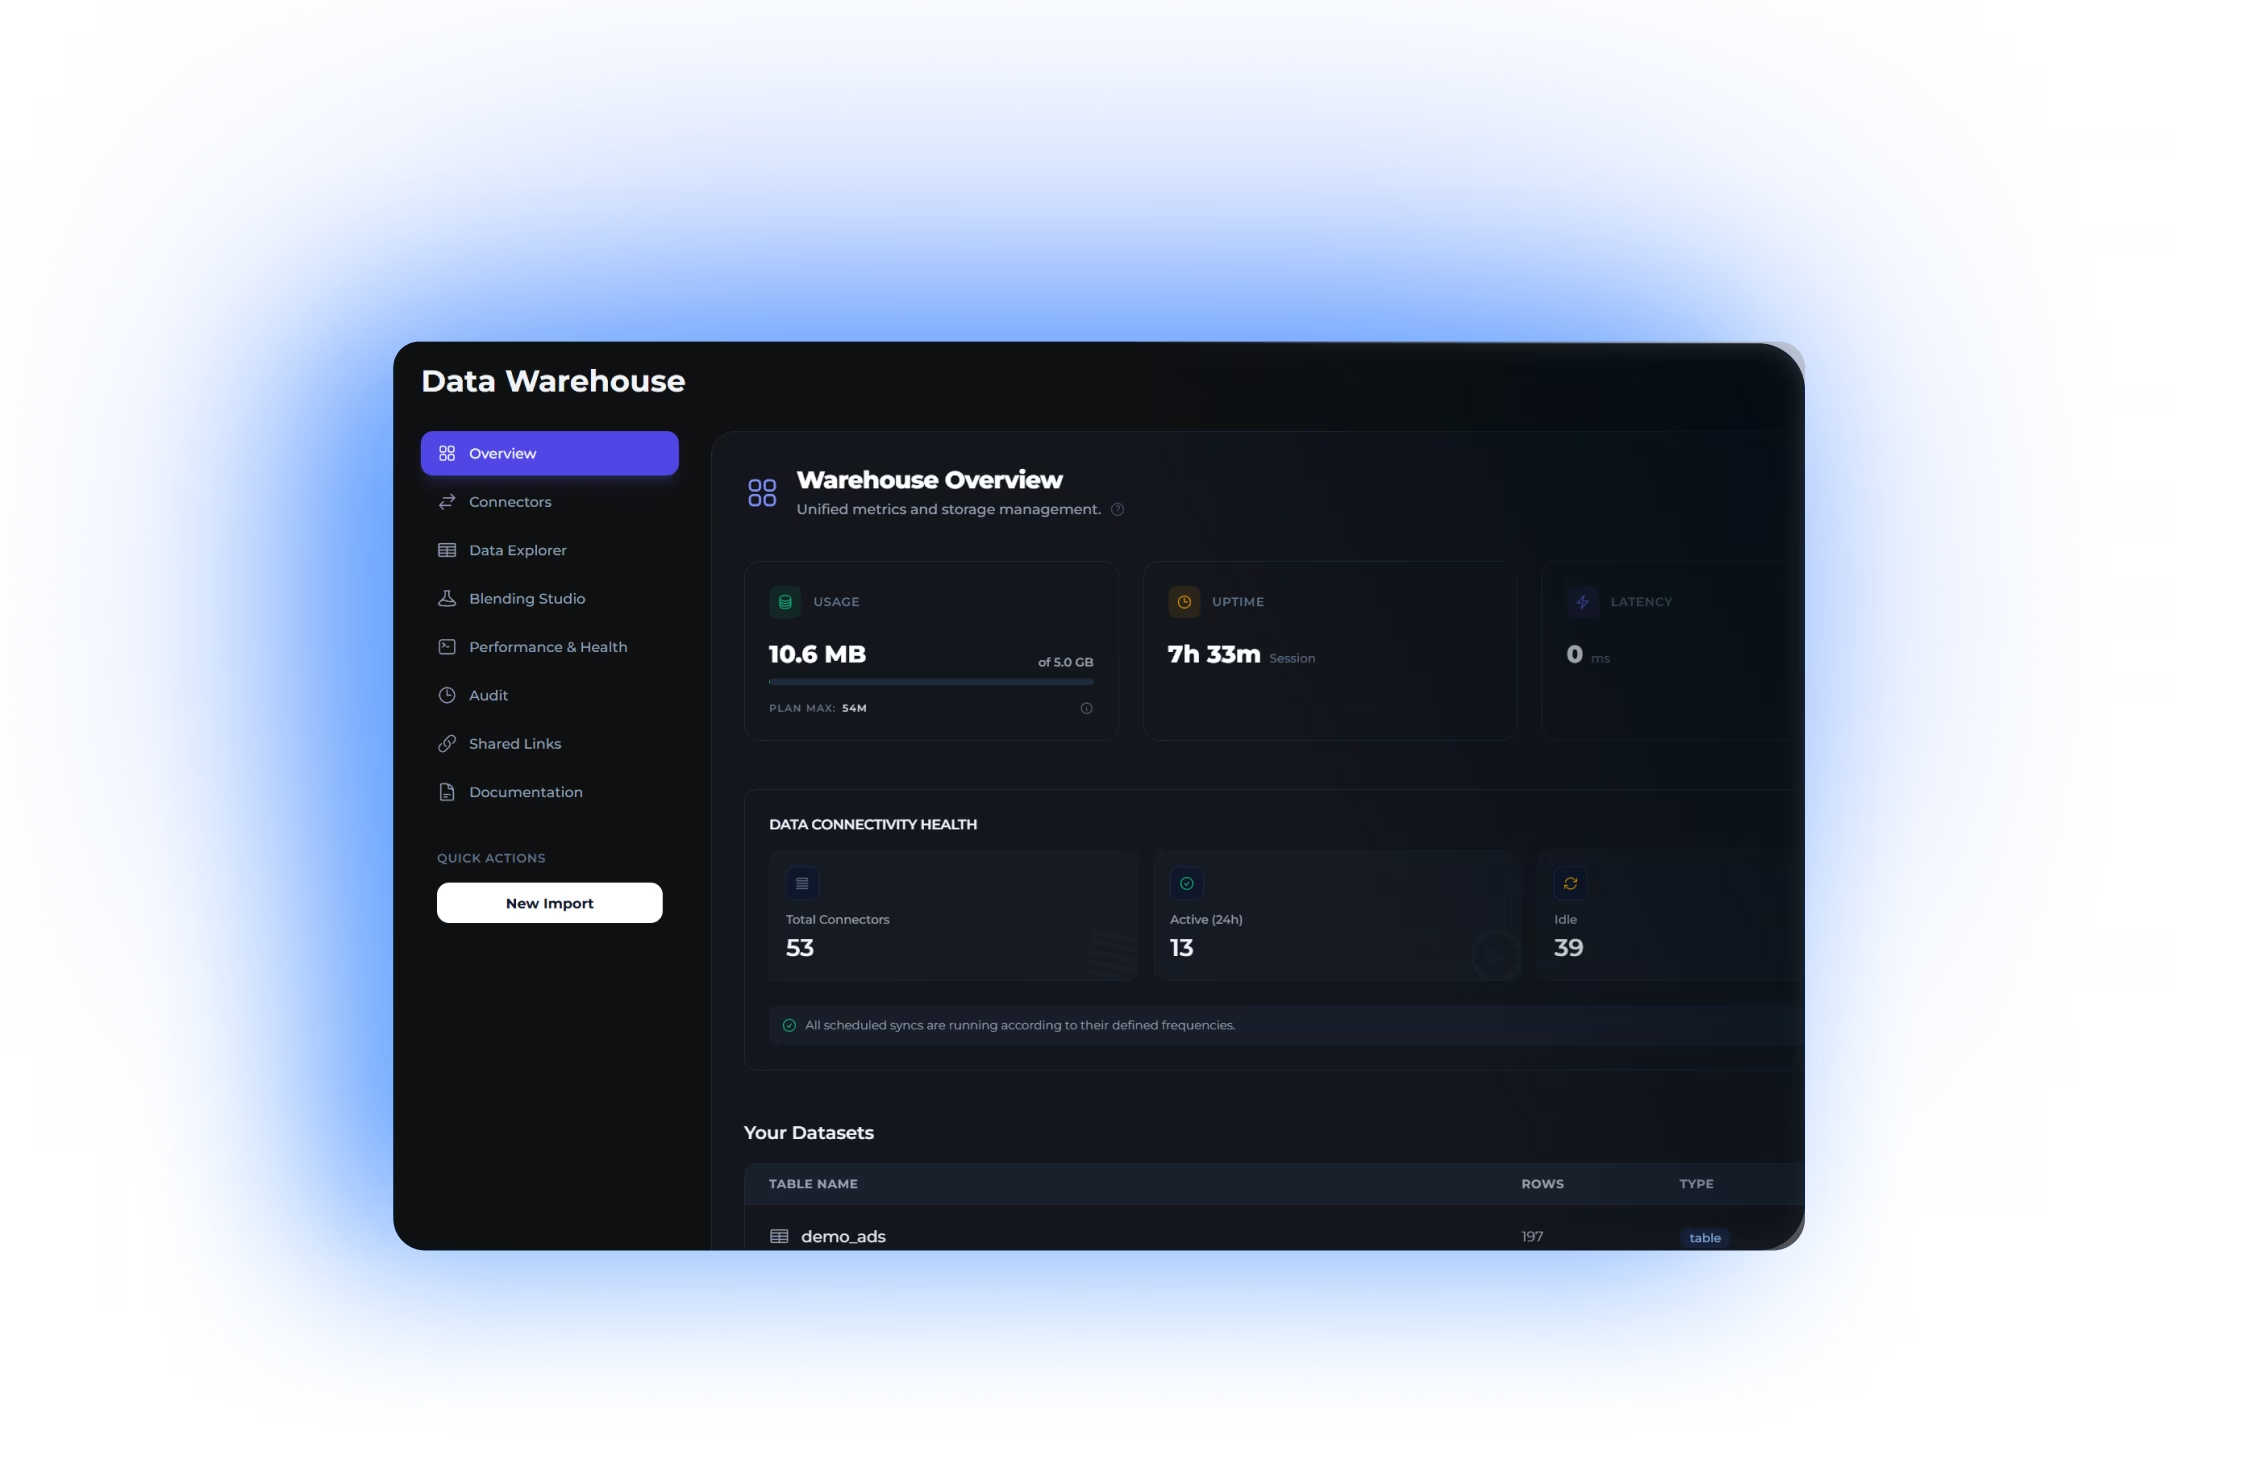
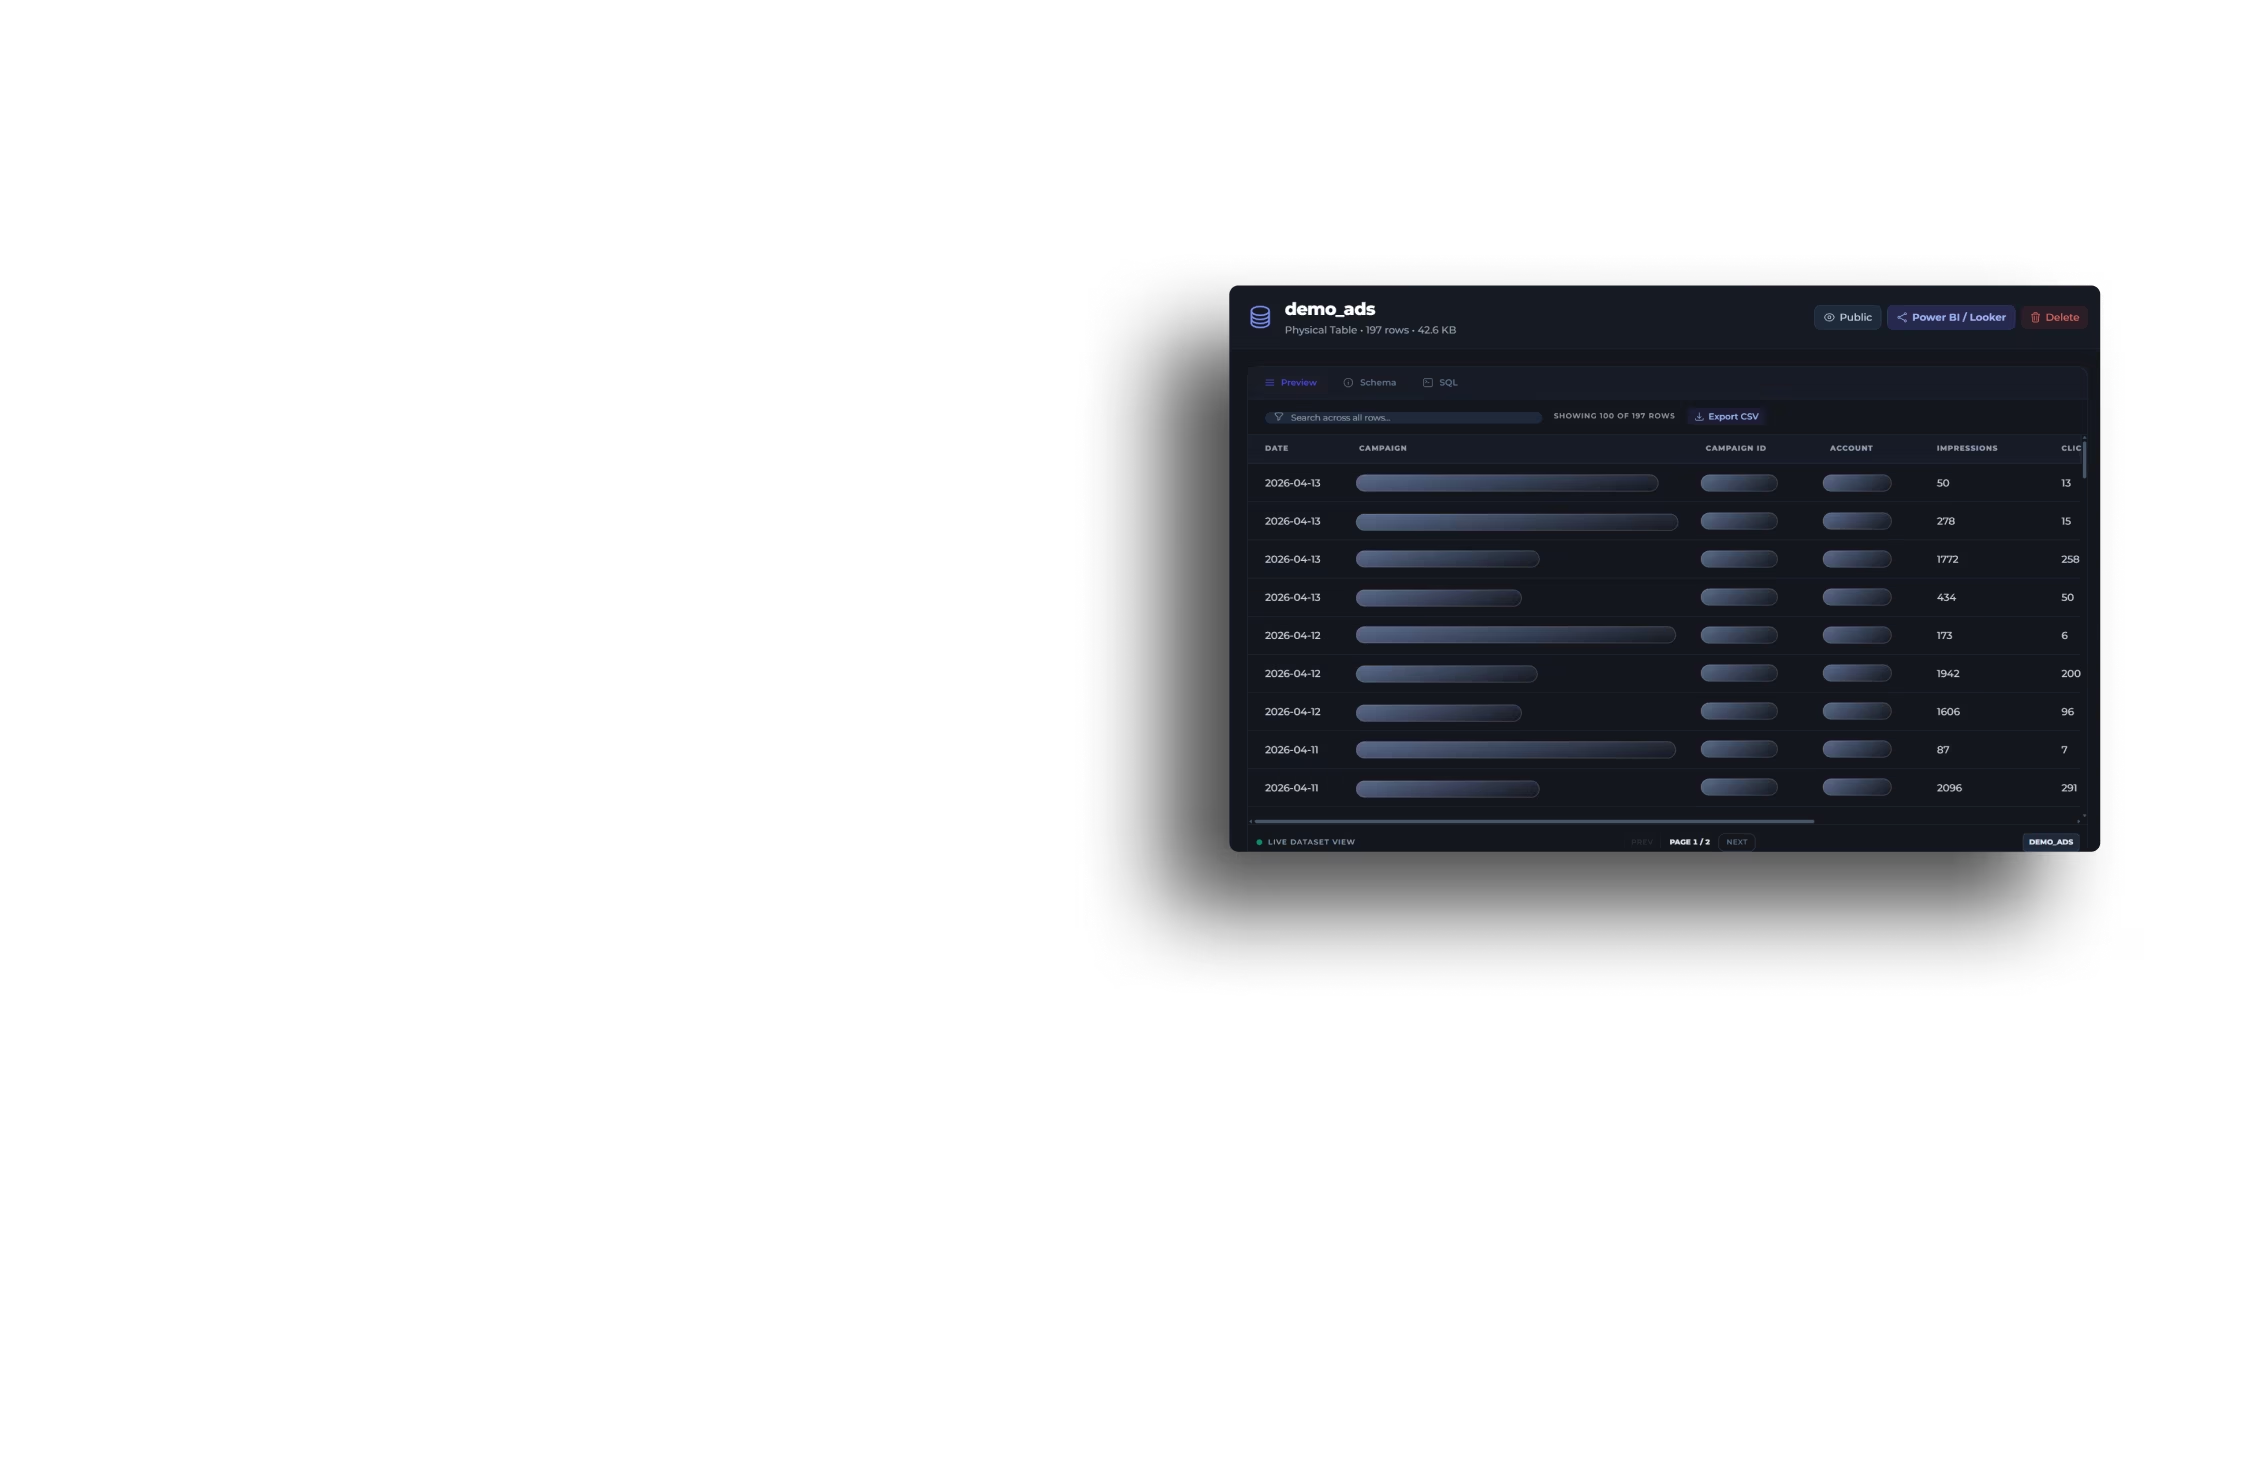
All your data, one secure home you own, governed, reliable and fully queryable with SQL. No external storage bill.
All 60+ connectors flow into one place
Secure, governed and reliable by default
Fully moldable with SQL when you need it
Replaces
Dashboards that build themselves
Interactive dashboards created by hand or generated by AI, with the right chart for every metric, ready to share.
Manual or AI-generated in seconds
Download, share and modify anything
Optimized layouts, no BI license
Replaces
An AI analyst on every dataset
Not more charts. Actual answers. The AI models your data, aggregates KPIs correctly, and tells you where to act.
Finds opportunities and problems for you
Aggregates ROAS the right way, every time
Writes the narrative, not just the numbers
Three products. One platform.
Everything you were stitching together,
now native
Atlas replaces your warehouse, your BI tool and your reporting workflow with one platform for all your business data.
Replaces
Your own data warehouse
All your data, one secure home you own, governed, reliable and fully queryable with SQL. No external storage bill.
All 60+ connectors flow into one place
Secure, governed and reliable by default
Fully moldable with SQL when you need it
Dashboards that build themselves
Interactive dashboards created by hand or generated by AI, with the right chart for every metric, ready to share.
Manual or AI-generated in seconds
Download, share and modify anything
Optimized layouts, no BI license
An AI analyst on every dataset
Not more charts. Actual answers. The AI models your data, aggregates KPIs correctly, and tells you where to act.
Finds opportunities and problems for you
Aggregates ROAS the right way, every time
Writes the narrative, not just the numbers
✦ Intelligence you can trust
An analytics engine,
not a black box
Atlas doesn't just wrap a chatbot around your data. It profiles, models and validates, so the answers are right, not just fluent.
It understands your data
Profiles every column, infers dimensions vs. measures with an LLM, detects additivity, and validates every query in SQL, so numbers aggregate correctly.
It finds what changed
Tracks trend, seasonality and growth across YoY, MoM and YTD, and flags anomalies with Isolation Forest, LOF and Z-score before they cost you.
It ranks what matters
Scores KPIs by business relevance, picks the right visualization for each one, and proposes names, formulas, hierarchies and the questions worth asking.
It separates signal from noise
The hard part isn't showing data. It's knowing what deserves attention. Atlas surfaces the real opportunity, flags the real problem, and refuses to dress up noise as a finding.
Dashboard signals
3 findings
Opportunity
Spain · Google Ads, 5.2× ROAS ▲
High and climbing, with the spend and revenue to justify scaling budget. Act on it.
Problem
Germany · Meta Ads, 1.4× ROAS ▼
Low and declining while spend keeps rising. Reallocate before it drains the account.
Noise
France · TikTok Ads, 2.9× ROAS
Sits near the account average. Correctly kept off the headline. Not every wobble is a story.
Note: the figures above are illustrative examples of the product UI, not real account data.
✦ Intelligence you can trust
An analytics engine,
not a black box
Atlas doesn't just wrap a chatbot around your data. It profiles, models and validates, so the answers are right, not just fluent.
It understands your data
Profiles every column, infers dimensions vs. measures with an LLM, detects additivity, and validates every query in SQL, so numbers aggregate correctly.
It finds what changed
Tracks trend, seasonality and growth across YoY, MoM and YTD, and flags anomalies with Isolation Forest, LOF and Z-score before they cost you.
It ranks what matters
Scores KPIs by business relevance, picks the right visualization for each one, and proposes names, formulas, hierarchies and the questions worth asking.
It separates signal from noise
The hard part isn't showing data. It's knowing what deserves attention. Atlas surfaces the real opportunity, flags the real problem, and refuses to dress up noise as a finding.
Dashboard signals
3 findings
Opportunity
Spain · Google Ads, 5.2× ROAS ▲
High and climbing, with the spend and revenue to justify scaling budget. Act on it.
Problem
Germany · Meta Ads, 1.4× ROAS ▼
Low and declining while spend keeps rising. Reallocate before it drains the account.
Noise
France · TikTok Ads, 2.9× ROAS
Sits near the account average. Correctly kept off the headline. Not every wobble is a story.
Note: the figures above are illustrative examples of the product UI, not real account data.
The shift
What changes when
Atlas does the heavy lifting
Same team, same data sources, but a completely different workflow and cost structure.
Without Atlas
fragmented · expensive · slow
Data scattered across 20+ disconnected connectors
Thousands/year for an external warehouse (BQ/Snowflake)
Thousands more for Tableau / Power BI licenses
Analysts lose hundreds of hours to imports & dashboards
Insights arrive days late, if at all
Your analyst is a report builder
With Atlas
unified · included · instant
Every source unified in one warehouse you own
Your warehouse is included, no external bill
Native dashboards, no BI license required
AI builds dashboards & reports in minutes
Signals surface in real time, automatically
Your analyst is a strategist
The shift
What changes when
Atlas does the heavy lifting
Same team, same data sources, but a completely different workflow and cost structure.
Without Atlas
fragmented · expensive · slow
With Atlas
unified · included · instant
Data scattered across 20+ disconnected connectors
Every source unified in one warehouse you own
Thousands/year for an external warehouse (BQ/Snowflake)
Your warehouse is included, no external bill
Thousands more for Tableau / Power BI licenses
Native dashboards, no BI license required
Analysts lose hundreds of hours to imports & dashboards
AI builds dashboards & reports in minutes
Insights arrive days late, if at all
Signals surface in real time, automatically
Your analyst is a report builder
Your analyst is a strategist
Who it's for
Built for the people who
live in the data
Whether you report to clients or to a CMO, Atlas hands you the decision instead of the raw material.
For agencies
Run every client and every ad account from one platform. Stop reselling BigQuery and Tableau. Start delivering intelligence as your product.
One source of truth across all clients
AI-built dashboards and reports, client-ready
Free your team to focus on strategy and Paid Media results
Purpose-built plans for agency workflows
For in-house teams
Give marketers and analysts a single, governed view of performance, plus an AI that hands them the next move, not just another chart.
All your business data, unified and owned
Self-serve dashboards for the whole team
Proactive alerts on the KPIs that matter
Decisions in minutes, not reporting cycles
Who it's for
Built for the people who
live in the data
Whether you report to clients or to a CMO, Atlas hands you the decision instead of the raw material.
For agencies
Run every client and every ad account from one platform. Stop reselling BigQuery and Tableau. Start delivering intelligence as your product.
One source of truth across all clients
AI-built dashboards and reports, client-ready
Free your team to focus on strategy and Paid Media results
Purpose-built plans for agency workflows
For in-house teams
Give marketers and analysts a single, governed view of performance, plus an AI that hands them the next move, not just another chart.
All your business data, unified and owned
Self-serve dashboards for the whole team
Proactive alerts on the KPIs that matter
Decisions in minutes, not reporting cycles
60+
Connectors, unified
3-in-1
Warehouse + dashboards + AI
0
External BI licenses needed
4.8/5
Dataslayer rating on G2
60+
Connectors, unified
3-in-1
Warehouse + dashboards + AI
0
External BI licenses needed
4.8/5
Dataslayer rating on G2
FAQ
Do I still need BigQuery or Snowflake?
No. Atlas includes your own data warehouse, so you don't pay a separate provider to store your data. If you already run BigQuery or Snowflake, Atlas can work alongside them, but it's designed to replace that line item, not add to it.
Do I need Tableau, Power BI or Looker Studio?
No. Dashboards are native to Atlas and can be built manually or generated by the AI. You can download, share and modify them freely, without buying a single BI seat.
Can my team still use SQL?
Absolutely. Your data stays fully moldable with SQL. Atlas gives analysts the control of a real warehouse and the speed of an AI layer on top, so you're never locked out of the raw data.
Which data sources are supported?
All of Dataslayer's 60+ connectors (Google Ads, Meta, GA4, HubSpot, Shopify, Stripe and more), plus your own databases (PostgreSQL, MySQL), warehouses (BigQuery, Snowflake, Redshift) and files (CSV, Google Sheets). If your business generates it, Atlas can hold it.
Who owns the data?
You do. Atlas is your warehouse and your dashboards, governed, secure and under your control.

FAQ
Do I still need BigQuery or Snowflake?
No. Atlas includes your own data warehouse, so you don't pay a separate provider to store your data. If you already run BigQuery or Snowflake, Atlas can work alongside them, but it's designed to replace that line item, not add to it.
Do I need Tableau, Power BI or Looker Studio?
No. Dashboards are native to Atlas and can be built manually or generated by the AI. You can download, share and modify them freely, without buying a single BI seat.
Can my team still use SQL?
Absolutely. Your data stays fully moldable with SQL. Atlas gives analysts the control of a real warehouse and the speed of an AI layer on top, so you're never locked out of the raw data.
How does the AI avoid giving me wrong numbers?
Atlas builds a semantic model of your data first, separating dimensions from measures, detecting additivity, and validating every query in SQL. Metrics like ROAS are aggregated correctly (SUM(revenue) / SUM(spend)), never by averaging row-level ratios. It's an analytics engine, not a chatbot guessing at your data.
Which data sources are supported?
All of Dataslayer's 60+ connectors (Google Ads, Meta, GA4, HubSpot, Shopify, Stripe and more), plus your own databases (PostgreSQL, MySQL), warehouses (BigQuery, Snowflake, Redshift) and files (CSV, Google Sheets). If your business generates it, Atlas can hold it.
Who owns the data?
You do. Atlas is your warehouse and your dashboards, governed, secure and under your control.
◆ ATLAS
Replace your stack with
one intelligent platform
Unify your data, automate your dashboards, and let AI surface the signals that grow revenue. See Atlas on your own data.
Request early access
Book a demo
Built by Dataslayer · Trusted by agencies and data teams worldwide
◆ ATLAS
Replace your stack with
one intelligent platform
Unify your data, automate your dashboards, and let AI surface the signals that grow revenue. See Atlas on your own data.
Request early access
Book a demo
Built by Dataslayer · Trusted by agencies and data teams worldwide

Replace your stack with one intelligent platform

Unify your data, automate your dashboards, and let AI surface the signals that grow revenue. See Atlas on your own data.

Book a Demo
Minimalist dark browser window outline with three buttons on top left and an address bar.Data Warehouse dashboard showing overview of usage 10.6 MB of 5.0 GB, uptime 7 hours 33 minutes, latency 0 ms, total connectors 53, active connectors 13, idle 39, with menu options on the left and dataset named demo_ads displayed.Abstract blue and purple logo of three vertical, curved bars resembling a stylized stack or columns on a dark background.Screenshot of a dark-themed table named demo_ads showing campaign data with columns for date, campaign, campaign ID, account, impressions, and clicks.Scenic mountain landscape with a river flowing through a pine forest under a cloudy sky during sunset.