


45% of U.S. ecommerce businesses use Stripe as their primary payment processor, but most can't easily match that payment data against marketing spend. Connecting Stripe to Google Sheets solves this by letting you pull revenue data directly into spreadsheets where you already track campaigns. You have five main options: manual CSV exports (free but time-consuming), API connector add-ons (technical but flexible), automation platforms like Zapier (simple triggers only), sync tools that update existing rows, or multi-source data connectors that combine Stripe with all your other marketing platforms. The right choice depends on whether you need real-time updates and how many other data sources you're analyzing.
Why Marketing Teams Need Stripe Data in Google Sheets
The Stripe dashboard shows you payment volume and customer counts. But when someone asks "which ad campaign brought our highest-value customers?" or "did that Instagram partnership actually drive revenue?", you're stuck switching between five different platforms trying to connect dots.
Stripe processed $1.4 trillion in payments in 2024, but the dashboard wasn't built for marketing analysis. You can't compare revenue against your Google Ads spend, email open rates, or landing page conversion rates without exporting everything manually. Performance marketing strategies require connecting payment data to campaign data, something the Stripe dashboard can't do alone.
Google Sheets fixes this. Pull your Stripe data into a spreadsheet and suddenly you can build formulas dividing total payments by total ad spend to calculate actual ROAS, create pivot tables showing monthly recurring revenue by acquisition channel, or set up conditional formatting that flags when failed payments spike. More importantly, you can share live dashboards with executives who need revenue updates but don't need full Stripe access.
The 100+ companies using Stripe to process over $1 billion annually got there by making decisions based on complete data, not guesses about which channels work.
The Multi-Tool Problem
You start by connecting Stripe to Google Sheets using Zapier. Works great for a few weeks. Then your boss asks to see Stripe revenue alongside Google Ads spend, so you add another connection. Then marketing wants Facebook Ads too.
Fast forward three months: Zapier pulling Stripe every 15 minutes, an API connector grabbing Google Ads daily, another Zapier for Facebook hourly, manually exported LinkedIn CSVs because you hit task limits, and VLOOKUP formulas spanning four sheets trying to join everything.
Each tool works fine individually. Together, they create a maintenance nightmare. One authentication expires and your report breaks. Date ranges don't align. You spend more time troubleshooting integrations than analyzing results.
Teams serious about data-driven marketing eventually consolidate onto platforms built for multi-source reporting. One authentication system. One refresh schedule. One workflow. Same 15-20 minute setup, but you save hours weekly not managing integrations.
5 Ways to Connect Stripe to Google Sheets
Method 1: Manual CSV Export
Download transaction data from Stripe, upload to Sheets. Works for occasional reports but falls apart for active campaigns, yesterday's data is outdated by the time you import it. Stripe processes transactions with updates available within 15 minutes; manual exports can't keep up.
Time: 10-15 min per export | Cost: Free | Updates: Manual
Method 2: API Connector Add-ons
Add-ons like API Connector or CData pull Stripe data through the API without coding. Install from Google Workspace Marketplace, get your Stripe API key, configure endpoints following Stripe's API documentation, and set refresh schedules.
The problem is that Stripe returns UNIX timestamps requiring conversion formulas, and only 10 records by default, needing pagination for thousands of transactions.
Time: 1-2 hours setup | Cost: $0-49/month | Updates: Scheduled
Method 3: Zapier and Make
Pre-built triggers add new transactions row-by-row as they happen. Great for bookkeeping. Less helpful for bulk historical analysis or complex calculations like comparing periods or calculating metrics across products.
Time: 30 min setup | Cost: $20-50/month | Updates: Event-triggered
Method 4: Two-Way Sync Platforms
Tools like Unito and Whalesync update existing rows when data changes rather than just appending. Customer upgrades subscription? Row updates. Payment status changes? Your sheet reflects current state instead of historical snapshots.
For marketing teams tracking customer journeys, this shows where customers are now, not where they were.
Time: 45 min setup | Cost: $30-100/month | Updates: Continuous
Method 5: Multi-Source Data Platforms
When you need Stripe plus Google Ads plus Facebook Ads plus email metrics in one place, single-purpose connectors break down. You end up with five different tools, five different authentication processes, and five different refresh schedules to manage.
Multi-source platforms solve this by treating data integration as a unified problem. Connect all your marketing and payment sources once, then pull whatever combination you need through a single interface.
This matters because over 300,000 businesses use Stripe Billing for subscriptions. Being able to pull subscription data alongside acquisition costs from multiple ad platforms makes it possible to calculate true payback period by channel, something you can't do with payment data alone.
Dataslayer, for example, handles 50+ marketing platforms including Stripe, Google Ads, Meta Ads, LinkedIn Ads, TikTok Ads, Google Analytics 4, and more. The workflow is consistent across all sources: connect once, select metrics, pick date ranges, generate tables. Whether you're pulling Stripe data or Google Ads data, the process takes the same 2-3 minutes.
The bigger advantage shows up in reporting. You can build a single query that pulls Google Ads spend, Facebook Ads spend, LinkedIn Ads spend, and Stripe revenue into one table with matching date ranges. Then calculate blended CAC, compare ROAS across channels, or build cohort analysis showing customer lifetime value by acquisition source.
These are calculations that require 4-5 different tools with other methods, each requiring separate authentication, separate scheduling, and manual date range matching. With a unified platform, you set it up once and your report updates automatically.
Time: 15-20 minutes setup | Cost: Free trial available, paid plans from $0-99/month | Updates: Scheduled or on-demand
Method Comparison Table
Setting Up Stripe with Dataslayer (Step-by-Step)
Here's the complete setup for marketing teams needing Stripe plus other platforms:
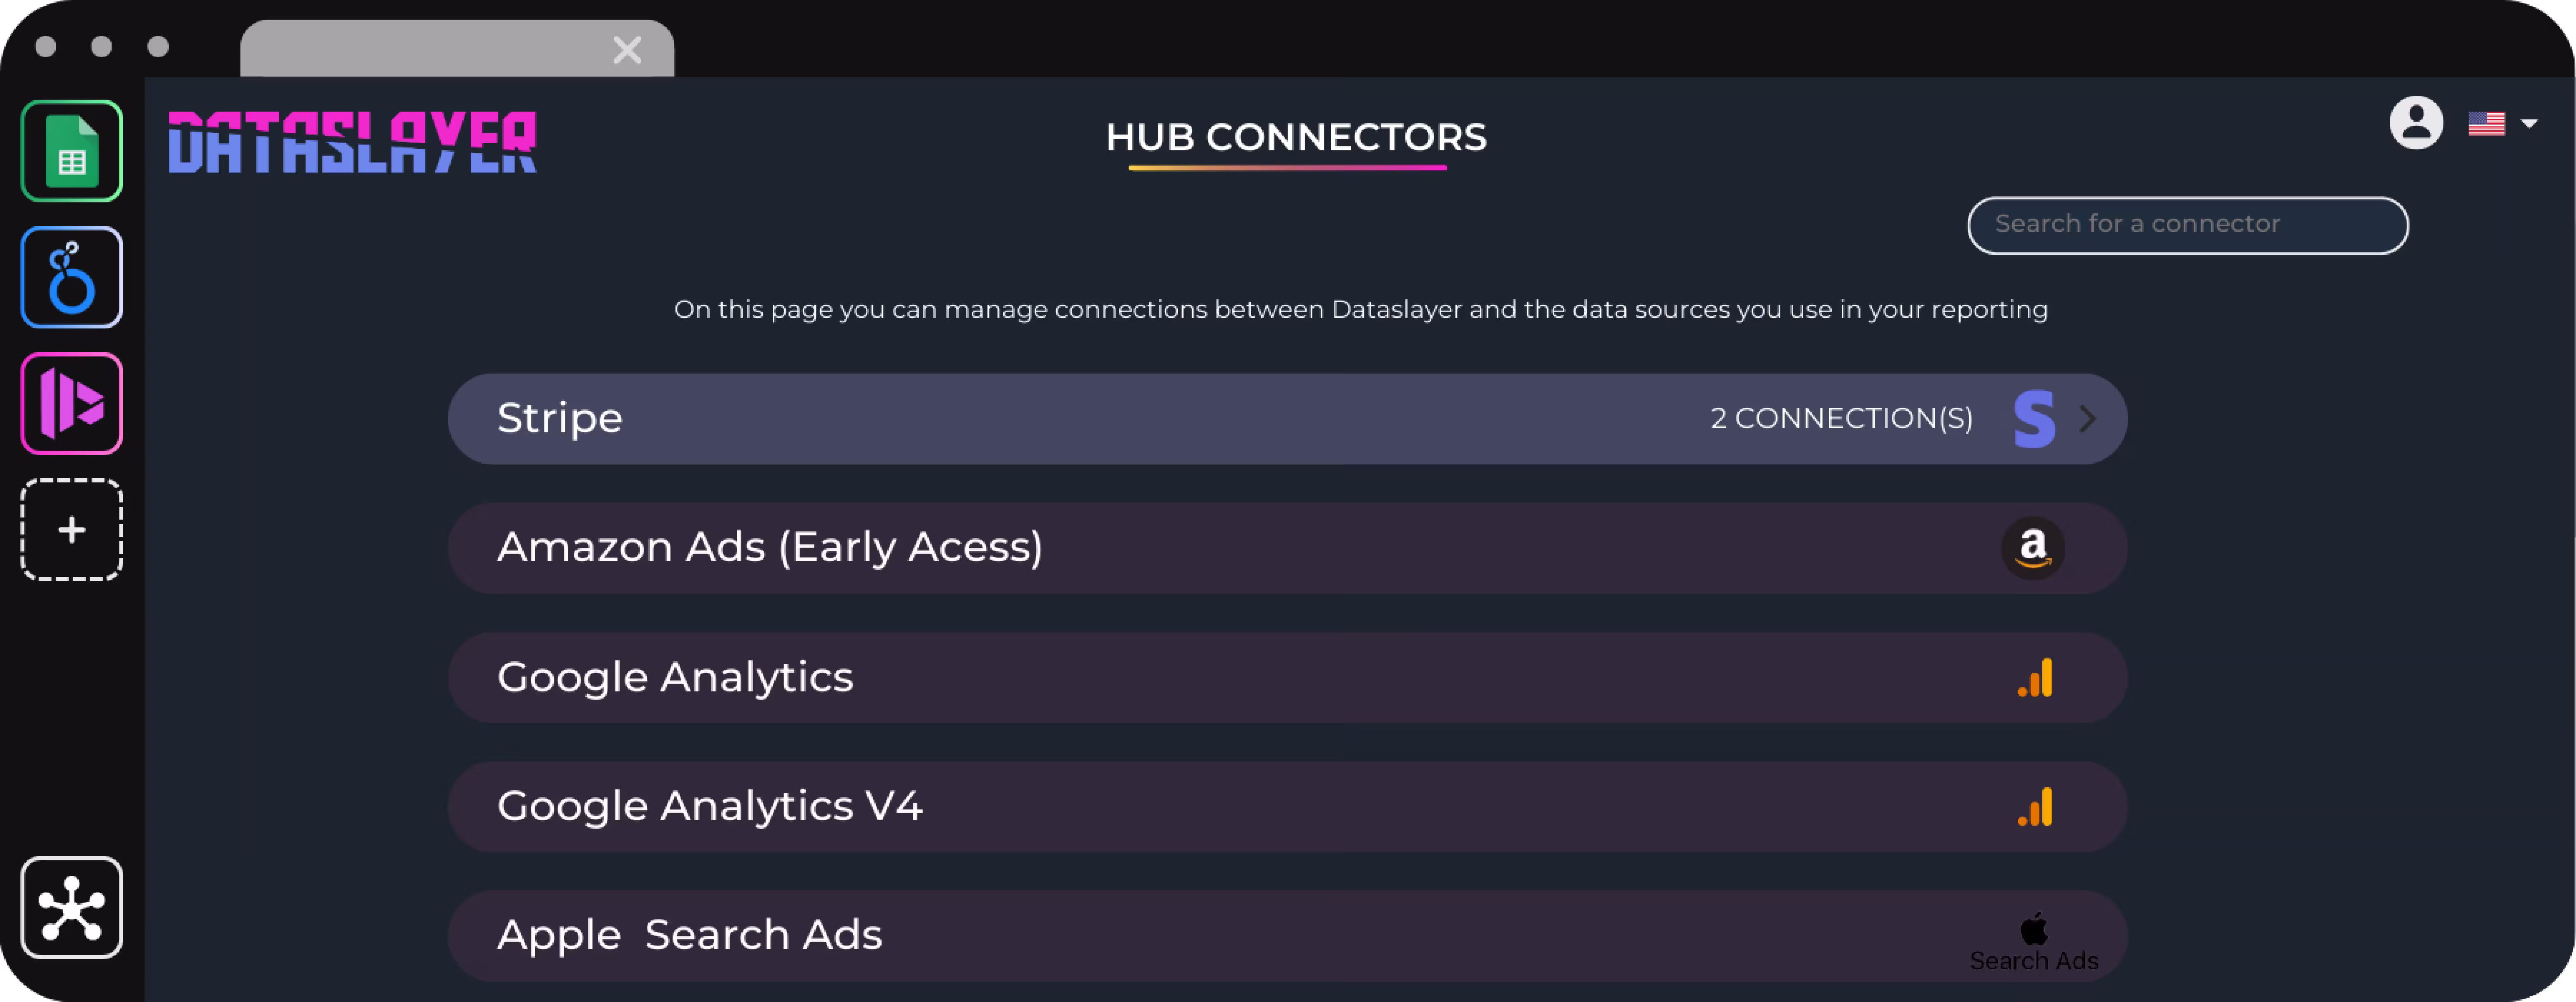
Step 1: Connect Your Stripe Account
- Log into Dataslayer
- Navigate to Hub > search "Stripe"
- Click "Add new account" > "Start to connect"
- Follow Stripe's authorization prompts
You authenticate once. After this, Dataslayer maintains the connection automatically. See the authentication guide for details.
Step 2: Create Your First Stripe Query
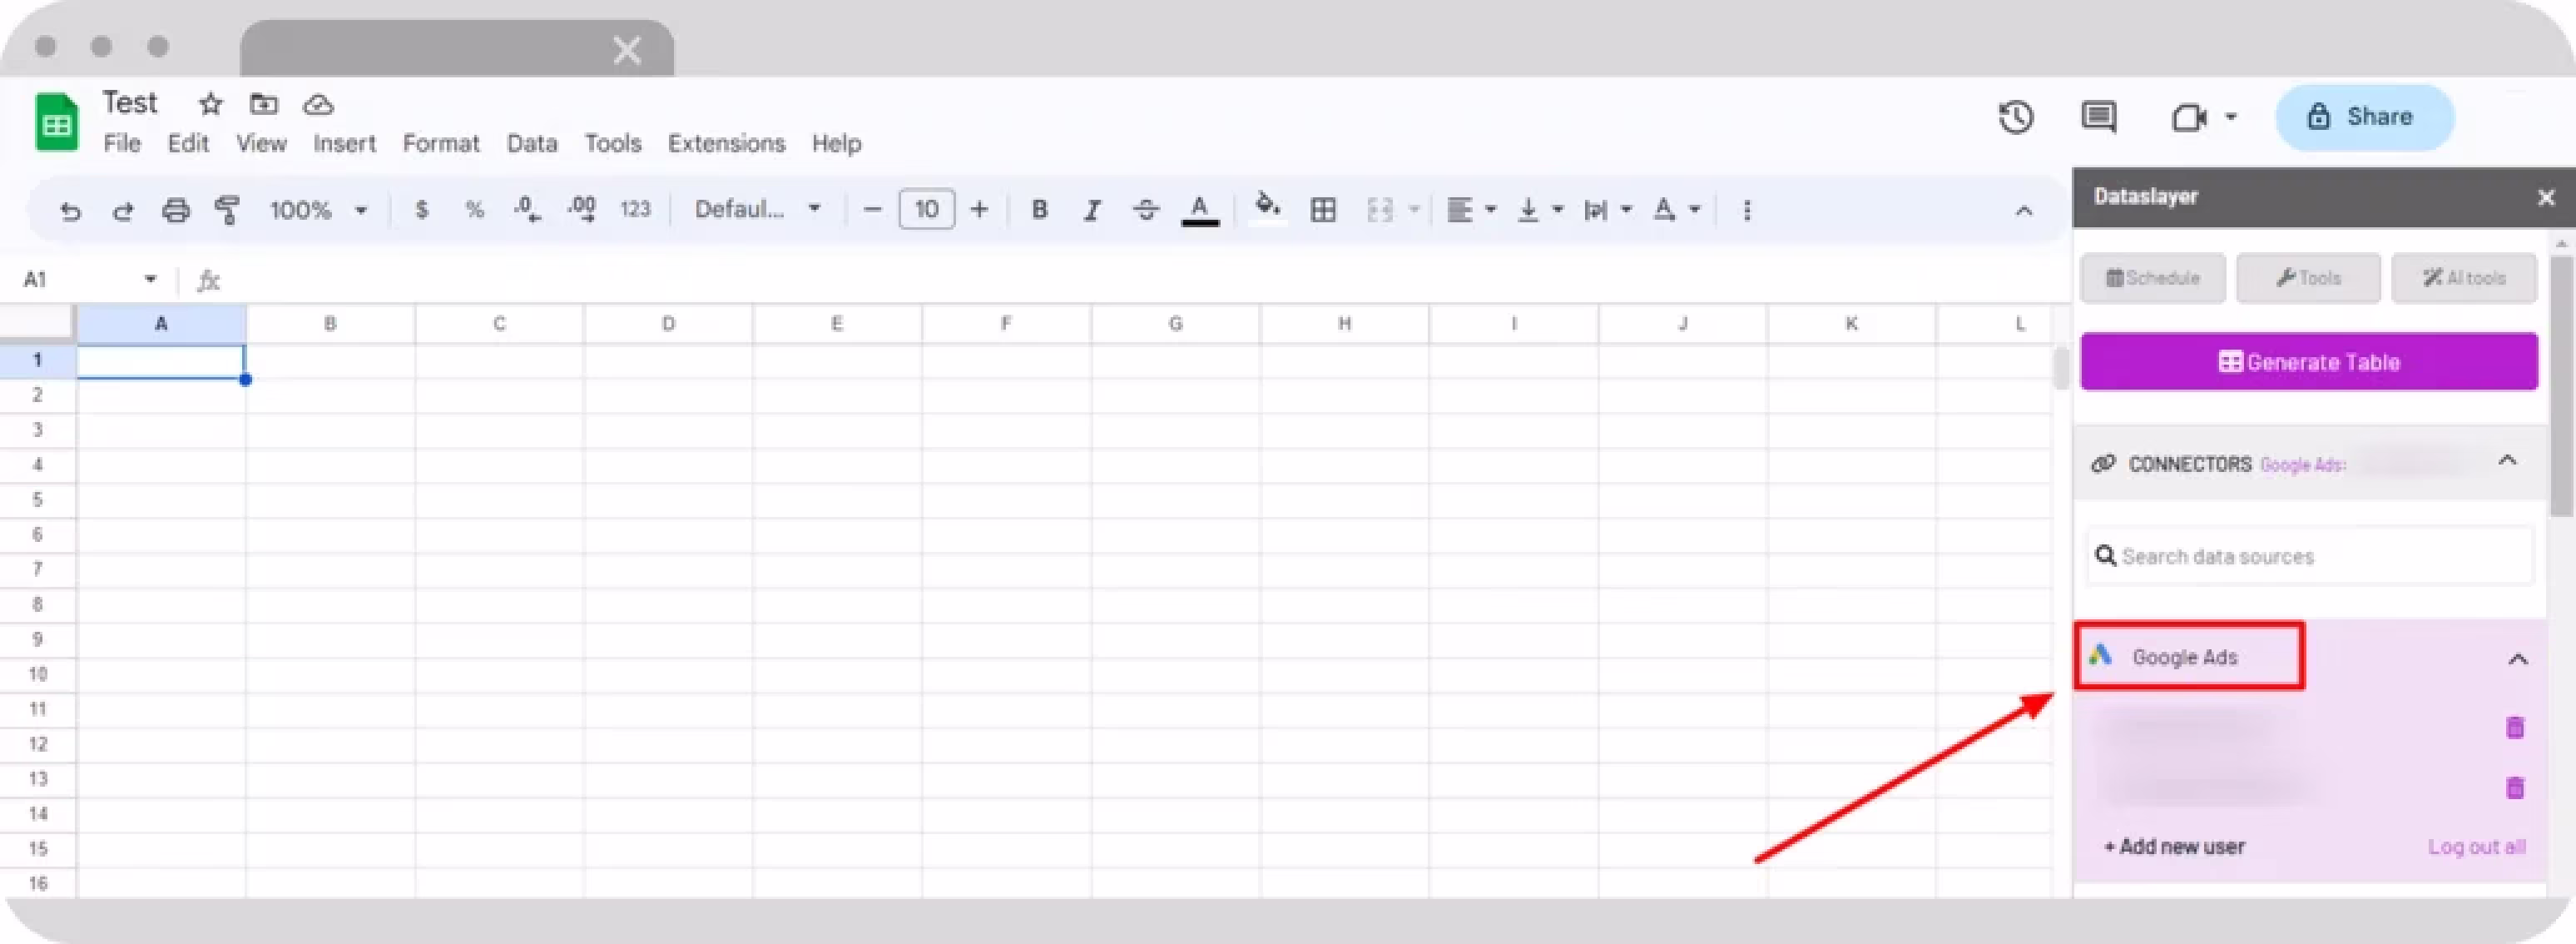
- Open Google Sheets > Extensions > Dataslayer > Launch Sidebar
- Select Stripe as your data source and choose your account
- Pick date range (shortcuts like "this month" work)
- Select metrics: revenue, transaction count, refunds, subscription MRR
- Select dimensions: date, product name, customer email, payment status
- Choose cell placement and click "Generate Table"
Stripe data appears in seconds, formatted and ready to analyze.
Step 3: Add Marketing Data Sources
Without leaving the spreadsheet:
- Click to a new area of your sheet
- Launch Dataslayer sidebar
- Select Google Ads (or Meta, LinkedIn, TikTok, GA4)
- Use the same date range as your Stripe data
- Pull metrics: ad spend, clicks, impressions, conversions
- Click "Generate Table"
Now payment and advertising data sit in the same sheet with identical date formats.
Step 4: Build Cross-Platform Calculations
With both datasets in place, create marketing metrics impossible with single platforms:
True ROAS: =SUM(Stripe_Revenue_Range) / SUM(Ads_Spend_Range)
Cost Per Paying Customer: =SUM(Total_Ad_Spend) / COUNTUNIQUE(Stripe_Customer_IDs)
Revenue Per Click: =SUMIF(Date_Range, Date, Stripe_Revenue) / SUMIF(Date_Range, Date, Ads_Clicks)
Step 5: Automate Report Updates
- Click on any query in your sheet
- In the sidebar, click "Schedule Report Refresh"
- Choose daily, weekly, or monthly updates
- Set the time and enable email notifications (optional)
Your spreadsheet updates automatically—open it Monday morning and see current numbers without manual work.
Pro Tips
Use consistent date ranges across all sources so data automatically aligns.
Name your queries clearly ("Stripe Revenue Daily", "Google Ads Spend").
Build a master dashboard with raw data queries on one sheet, calculations on another.
Schedule together so everything refreshes simultaneously.
Why the Unified Approach Wins
Patchwork: Install Zapier for Stripe (20 min) + API Connector for Google Ads (45 min) + Facebook solution (30 min) + VLOOKUP formulas (20 min) + debug dates (15 min). Total: 2+ hours, ongoing maintenance.
Unified (Dataslayer): Connect Stripe (3 min) + pull query (3 min) + add platforms (3 min each) + formulas (5 min) + schedule (2 min). Total: 15-20 minutes.
Three months later: patchwork = troubleshooting errors, unified = building reports.
Real Marketing Use Cases
Calculate True Customer Acquisition Cost
Google Ads shows cost per conversion, but conversions aren't paying customers. Pull ad spend and Stripe payment data into one sheet: =SUM(ad_spend_range) / COUNTUNIQUE(stripe_customer_IDs)
The challenge is date alignment, manual methods require matching periods across sources, then joining with formulas. Platforms handling multiple sources align dates automatically, reducing a 30-minute process to 3 minutes.
Track Which Channels Have Better Retention
Match Stripe subscription cancellations to UTM data and pivot by channel. When Stripe Billing manages nearly 200 million active subscriptions, knowing which channels bring sticky customers is critical. This requires combining subscription events with historical campaigns, straightforward when both live in one system, tedious across multiple CSVs.
Find Your Most Valuable Traffic Sources
That blog post driving 10,000 visits might generate zero revenue while a tiny PPC campaign converts at 15%. Pull GA4 traffic and Stripe revenue into one report, sort by revenue per visitor. Multi-platform analysis shines here, instead of exporting separately then VLOOKUPing for 20 minutes, pull both into a matched table instantly.
Build an MRR Waterfall
Your MRR went up $15,000, but why? Create a waterfall showing starting MRR + new + expansion - contraction - churn = ending MRR. Stripe Billing provides the subscription data, and unified reporting gives you visualization that explains what happened. This type of analysis is essential for tracking marketing ROI effectively, especially when matching MRR changes to specific campaigns that drove highest-value subscriptions.
Common Issues and Solutions
Different currencies: Use Stripe's currency field to convert everything to your reporting currency, filter to one currency, or analyze separately by currency.
UNIX timestamps: Stripe returns dates as 1704067200 instead of "January 1". Use =EPOCHTODATE(timestamp_cell, 1) or use a connector that converts automatically.
API rate limits: Batch requests instead of hitting the API constantly. Most connectors handle rate limiting and caching automatically.
Duplicates: Same payment appears multiple times if attempted, failed, then succeeded. Use UNIQUE() or filter by final status. Stripe's analytics deduplicate by default.
Subscription vs. invoice mismatches: Active subscriptions, total subscriptions (including canceled), and subscription invoices are different metrics measuring different things.
Data Security Considerations
Use view-only Stripe API keys when possible, your connection only needs read access, not permission to create charges. Never include full credit card numbers in exports (Stripe provides last 4 digits and card brand, which is enough for analysis).
Check GDPR and CCPA compliance if storing customer names, emails, and payment amounts. Some teams solve this by using aggregate metrics instead of customer-level data, restricting sheet access to specific members, or automatically purging old data after 90 days.
Watch Google Sheets permission levels: "Can view" for most team members, "Can edit" only for those who need it. If your sheet auto-updates and emails results, make sure sensitive data isn't going to personal email addresses.
Frequently Asked Questions
Can I connect Stripe to Google Sheets without coding?
Yes. Multiple no-code options exist, the only "technical" step is copying your Stripe API key. Most people complete setup in under 20 minutes.
How often does my Stripe data update?
Manual exports update when you import. Zapier triggers immediately on new events. API connectors refresh every 1-24 hours. Multi-source platforms let you schedule hourly to monthly, or refresh on-demand. Most marketing teams find daily updates sufficient.
Will this affect my payment processing?
No. You're only reading data. Even if your connection breaks, customers pay normally. Worst case: your report stops updating. Your payment flow continues working.
Can I pull historical Stripe data?
Yes, most methods let you specify date ranges. Be aware that years of transaction-level data creates massive spreadsheets, 100,000 transactions = 100,000 rows. For large datasets, aggregate to daily summaries or start with recent data.
What's the difference between Google Sheets vs. Looker Studio?
Use Sheets for custom calculations, multi-source combining, quick analysis, and collaboration. Use Looker Studio for visual dashboards, polished executive reports, and embedding. Most teams use both: Sheets for analysis, Looker Studio for visualization. Platforms like Dataslayer support both destinations.
Getting Started
Pick one specific question you can't currently answer: "Which marketing channel brings customers with the highest average order value?"
To answer that, you need Stripe payment data (total revenue per customer) and UTM tracking or marketing platform data (source/medium for each customer) in the same spreadsheet with a common customer identifier.
Your method depends on scope. If you only care about Stripe data, an API connector add-on works. If you need Stripe plus one marketing platform occasionally, try Zapier. But here's what actually happens in most marketing departments: you start by connecting Stripe, then realize you need Google Ads data too, then Facebook Ads, then LinkedIn, then GA4 traffic sources. Suddenly you're managing five different tools with five different authentication flows and five different refresh schedules.
This is why marketing teams with serious reporting needs use platforms built for multi-source integration. One authentication flow. One refresh schedule. One place to manage all your data sources. Whether you're pulling from 3 platforms or 30, the workflow stays consistent.
The goal isn't perfect data on day one. It's stopping decisions based on incomplete information. Once you see actual revenue sitting next to actual spend in the same spreadsheet, you stop guessing which campaigns work.
Ready to see what complete data looks like? Dataslayer connects Stripe plus 50+ marketing platforms (Google Ads, Meta Ads, LinkedIn Ads, TikTok Ads, GA4, Search Console, and more) to Google Sheets, Looker Studio, BigQuery, and Power BI. Free 15-day trial, no credit card required. Set up your first cross-platform report in under 20 minutes and see what you've been missing.


