

Pulling LinkedIn Ads data into Google Sheets lets you analyze campaign performance without logging into Campaign Manager every day. Manual exports work for occasional reports, but 73% of B2B marketers waste 5+ hours per week on repetitive data tasks. This guide covers three methods: manual CSV downloads (free, tedious), LinkedIn API setup (technical, flexible), and automation tools (fastest, requires budget). You'll learn when to use each method and how to avoid common data formatting issues.
Method Comparison: How to Get LinkedIn Ads Data Into Google Sheets
Why LinkedIn Ads Data Belongs in Google Sheets
LinkedIn Campaign Manager shows your metrics, but it's not built for cross-channel analysis or custom reporting. Here's what happens when you export to Google Sheets:
- You can compare LinkedIn performance with other channels. If you're running Google Ads and LinkedIn simultaneously, seeing cost per lead side-by-side tells you where to shift budget. Campaign Manager won't show you that your LinkedIn CPL is $82 while Google Search is $34.
- Your team gets real-time access without logins. Not everyone needs Campaign Manager access (or should have it). A shared Google Sheet gives stakeholders the numbers they need without security risks.
- Historical data becomes searchable. LinkedIn keeps 12 months of data in the interface. Export monthly, and you can track year-over-year trends, seasonal patterns, and campaign evolution dating back years.
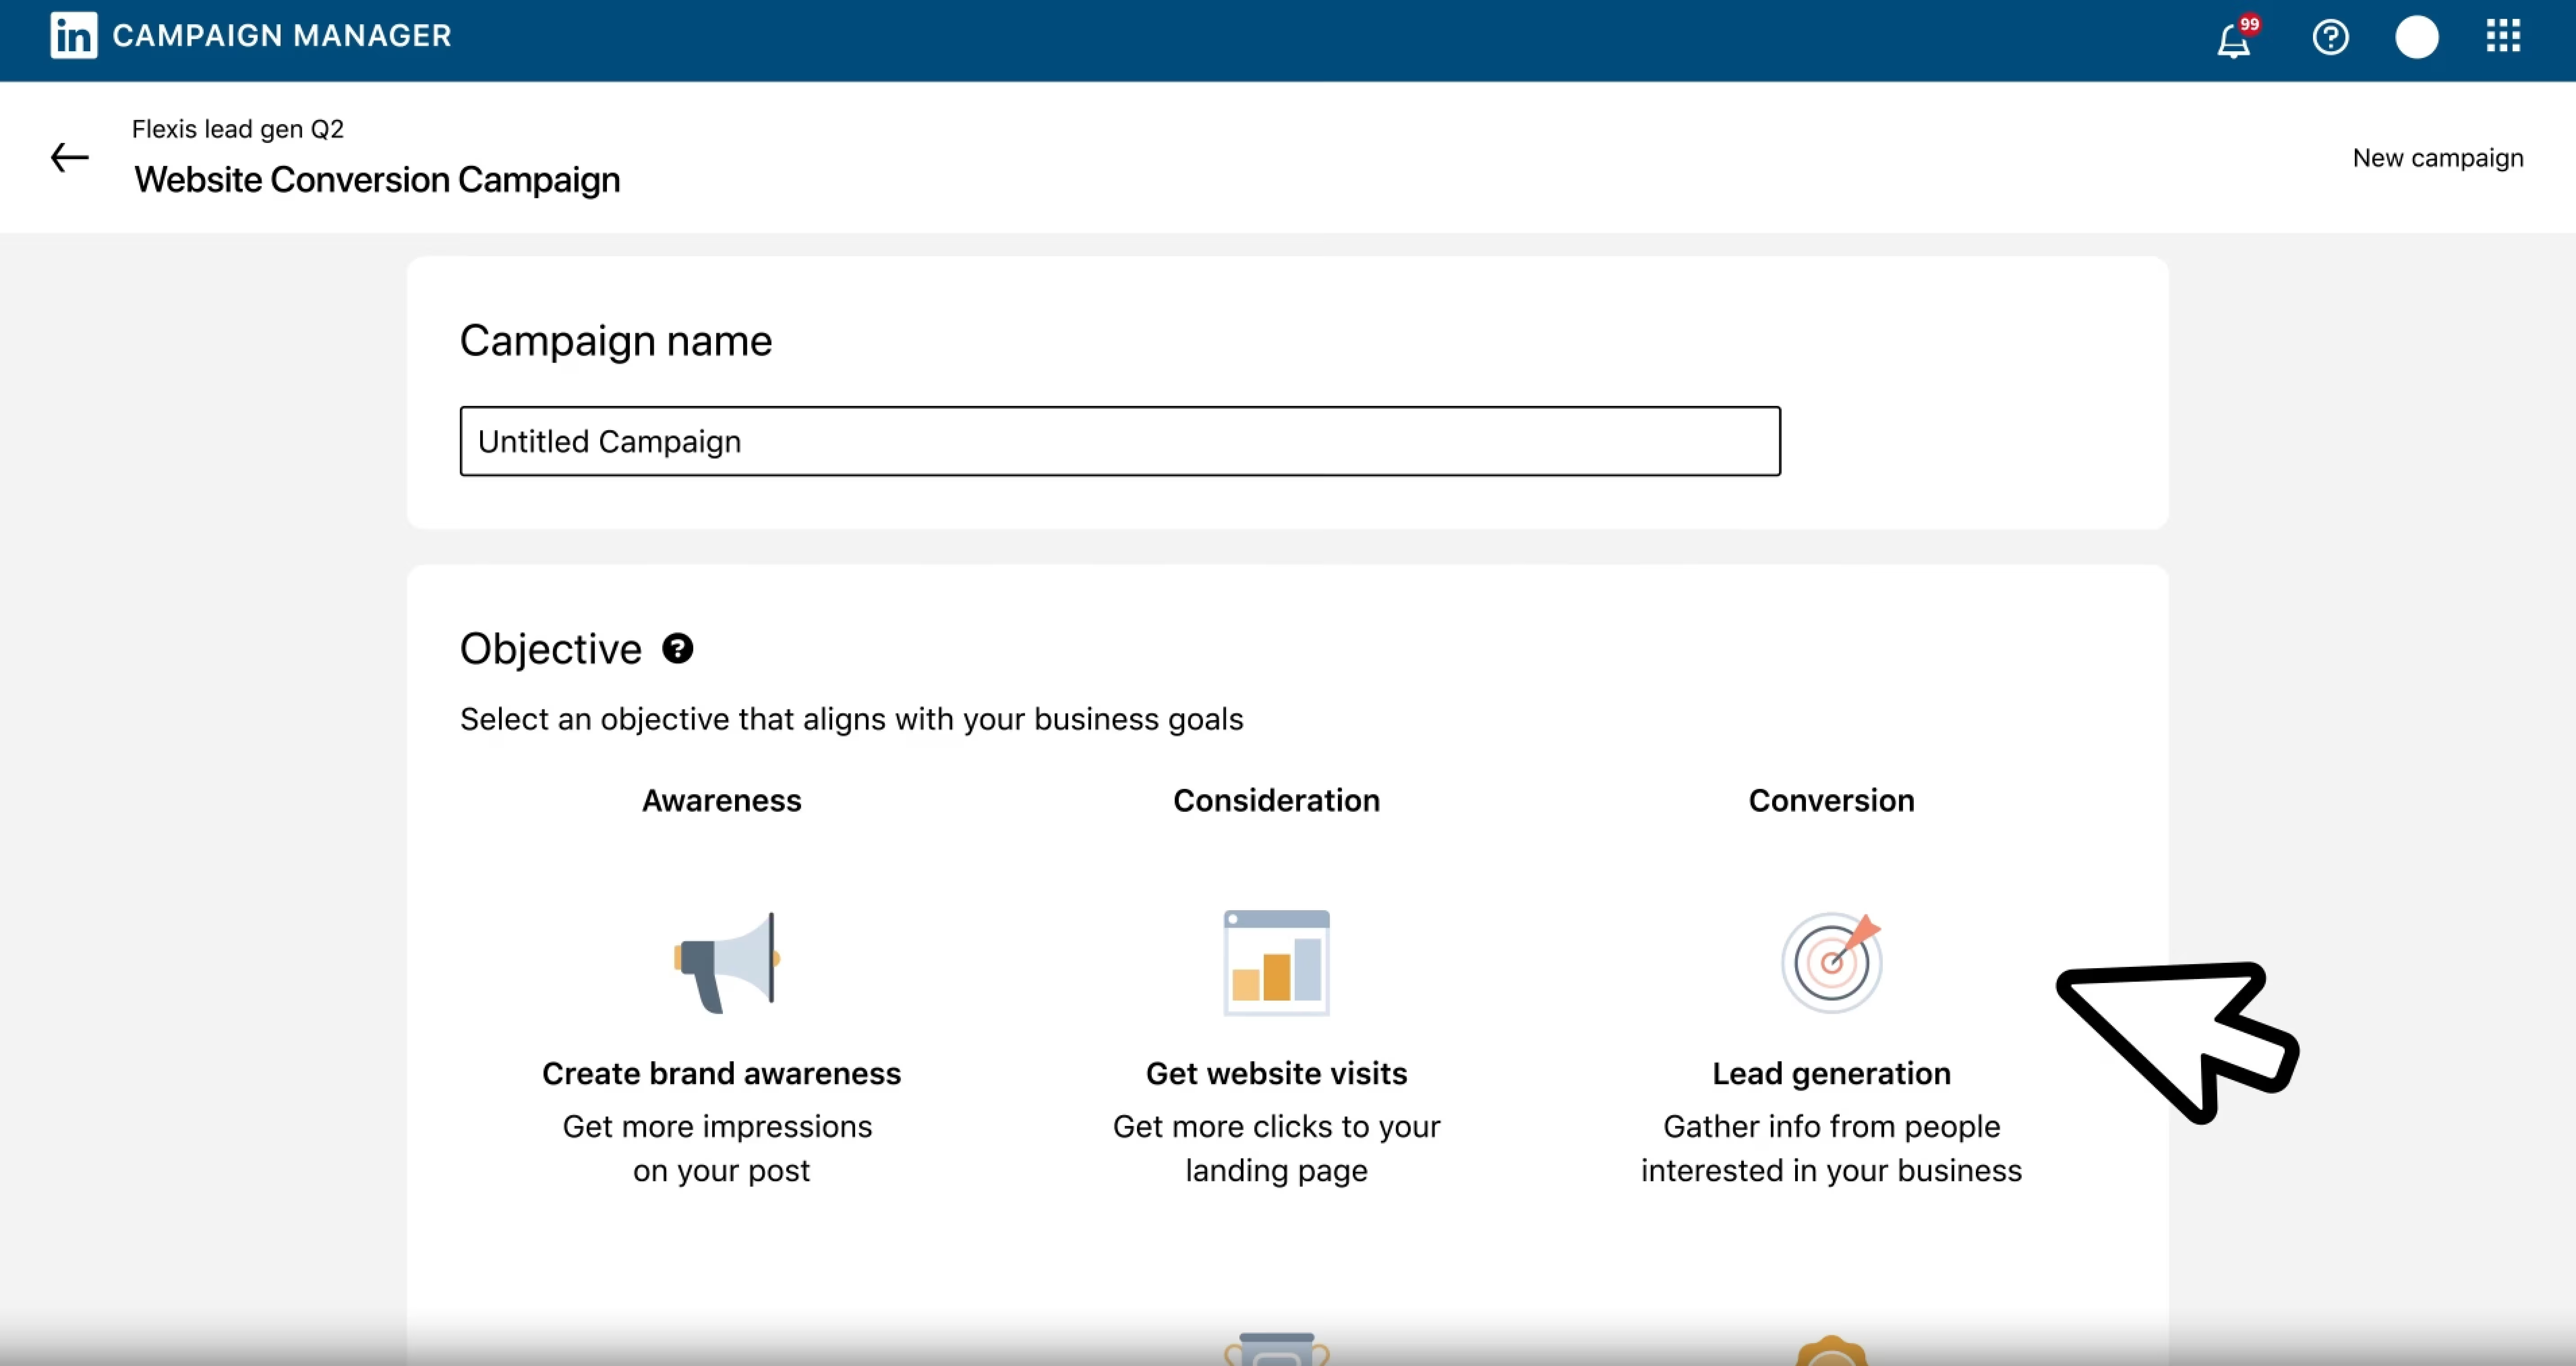
Method 1: Manual CSV Export from LinkedIn Campaign Manager
This works if you need data once a month or manage 1-2 small accounts.
Step-by-Step Manual Export
1. Go to Campaign Manager and select your account.
2. Navigate to the Reporting tab in the left sidebar.
3. Choose your date range. LinkedIn defaults to "Last 30 days" but you can customize. Pro tip: Always use complete weeks (Monday-Sunday) or months for cleaner comparisons.
4. Select metrics to export. LinkedIn shows 15 default columns (impressions, clicks, spend, conversions). Click "Columns" to add video metrics, demographic breakdowns, or conversion types. Learn more about available report types in LinkedIn's Help Center.
5. Click "Export" (top right) → "Export as CSV."
6. Open the CSV in Google Sheets. File → Import → Upload tab → Select your LinkedIn CSV.
Problems You'll Hit (And Fixes)
Date formats appear as text. LinkedIn exports dates as "MM/DD/YYYY" strings. Google Sheets won't recognize them for charting. Fix: Use =DATEVALUE(A2) where A2 is your date cell.
Currency symbols break calculations. If your account uses USD, the CSV adds "$" to spend values. Remove it with: =VALUE(SUBSTITUTE(A2,"$",""))
Multiple CSVs create version chaos. Solution: Name files with the date range like "linkedin_ads_2025-02-01_to_2025-02-28.csv"
Method 2: LinkedIn Marketing API (For Developers)
If you're comfortable with code, the LinkedIn Marketing API lets you pull data programmatically.
What You Need
LinkedIn Developer Account: Create an app at developer.linkedin.com. You'll get a Client ID and Client Secret.
OAuth 2.0 Setup: LinkedIn requires OAuth authentication. Your script needs to handle token refresh every 60 days.
API Access Tier: Free tier allows 100 requests per day. "Marketing Developer Platform" tier (requires application approval) allows 100,000+.
When API Makes Sense
You're pulling data for 10+ accounts. Manual exports become unsustainable. API calls can loop through multiple accounts in one script.
You need hourly/daily updates. Set up a trigger in Apps Script to run every 24 hours. Fresh data waiting when you open your Sheet.
You're building custom dashboards. If you're feeding data to Looker Studio, Power BI, or internal tools, the API gives you raw data without manual steps.
API Limitations
Rate limits reset daily. If you hit 100 requests, you're locked out until midnight Pacific Time.
Historical data limited to 2 years. You can't pull campaign data from 2022 if it's now 2025.
No raw timestamps. The API returns aggregated metrics (daily, weekly, monthly), you can't get hour-by-hour impressions.
Method 3: Export LinkedIn Ads to Google Sheets Automatically with Dataslayer
If you need LinkedIn Ads data in Google Sheets daily or weekly, manual exports waste hours and API coding takes days. Dataslayer automates the entire process in 15 minutes.
How Dataslayer Works for LinkedIn Ads
Dataslayer connects directly to your LinkedIn Ads account and pulls data to Google Sheets on whatever schedule you set. Once configured, you wake up to fresh data every morning, no CSV downloads, no copy-pasting, no OAuth token management.
You get 80+ LinkedIn Ads metrics automatically. Campaign Manager's default export gives you 15 columns. Dataslayer offers every metric LinkedIn provides: impressions, clicks, CTR, CPC, video completion rates, lead generation metrics (One Click Leads, cost per lead), conversions, viral metrics, and InMail performance.
Demographic breakdowns happen automatically. LinkedIn's CSV export requires separate downloads for demographic data. Dataslayer pulls everything in one query: company size, industry, seniority, job function, and geographic data. This means you can answer "Which seniority level has the lowest cost per lead?" without exporting five separate reports.
Multi-account management is built-in. If you manage LinkedIn Ads for multiple clients, Dataslayer pulls all accounts into one Google Sheet with automatic account labeling. One agency client exports 12 LinkedIn Ads accounts every morning, what used to take 90 minutes now happens automatically.
Setting Up LinkedIn Ads Export with Dataslayer
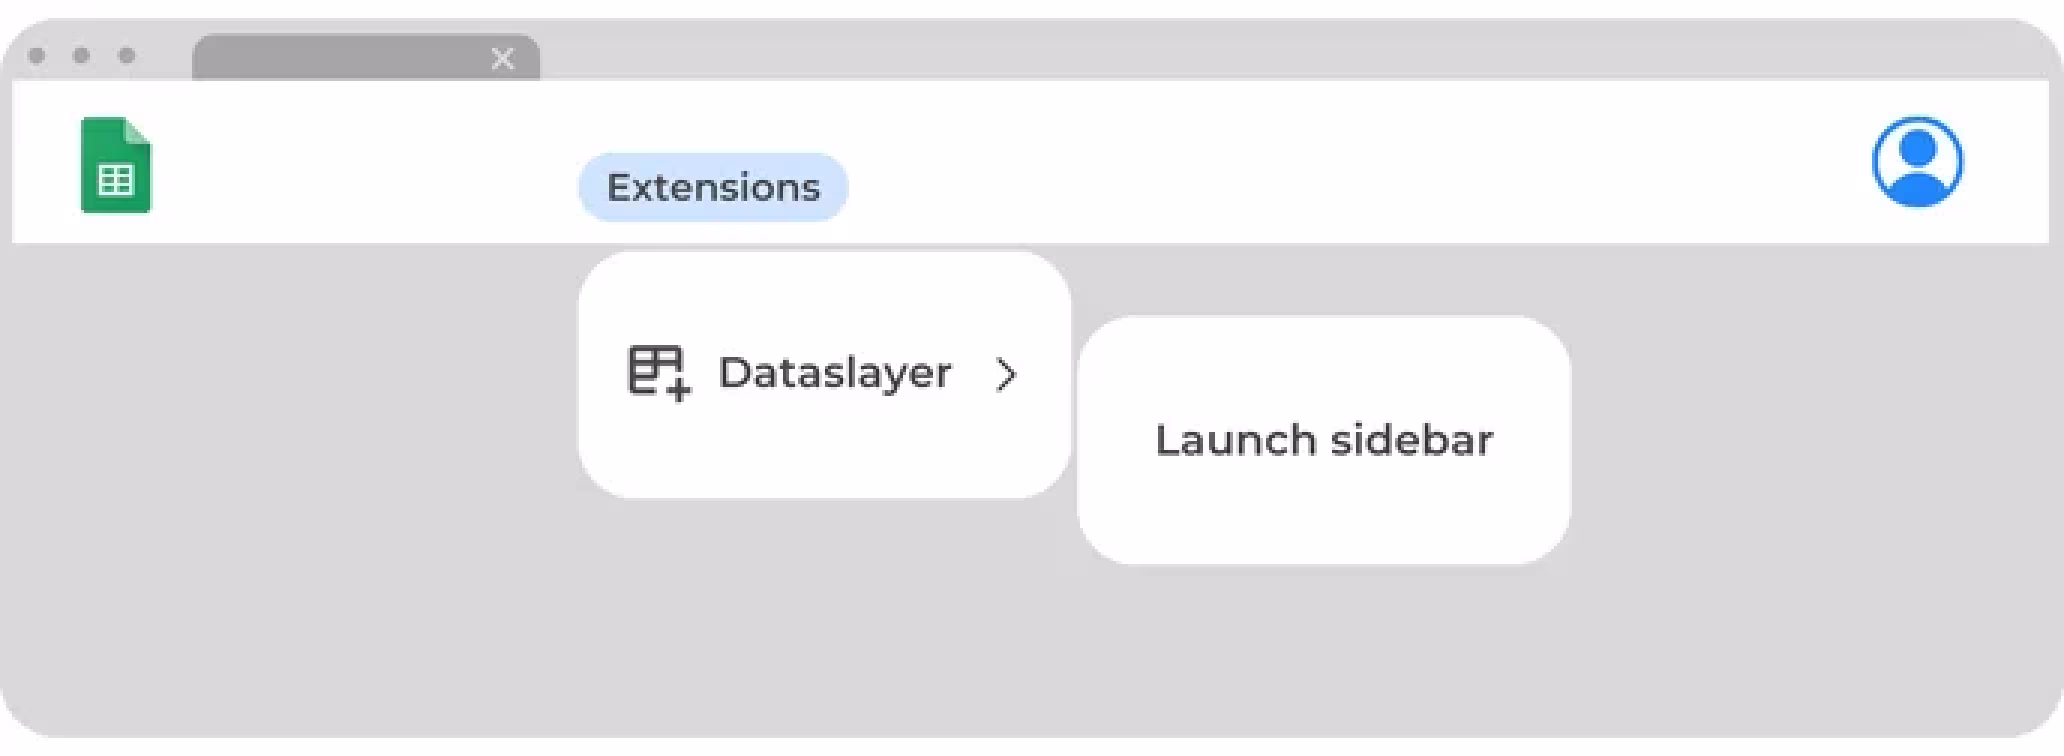
Step 1: Open Dataslayer Sidebar
Install the Dataslayer add-on from Google Workspace Marketplace. Open your Google Sheet, click Extensions → Dataslayer → Launch Sidebar.
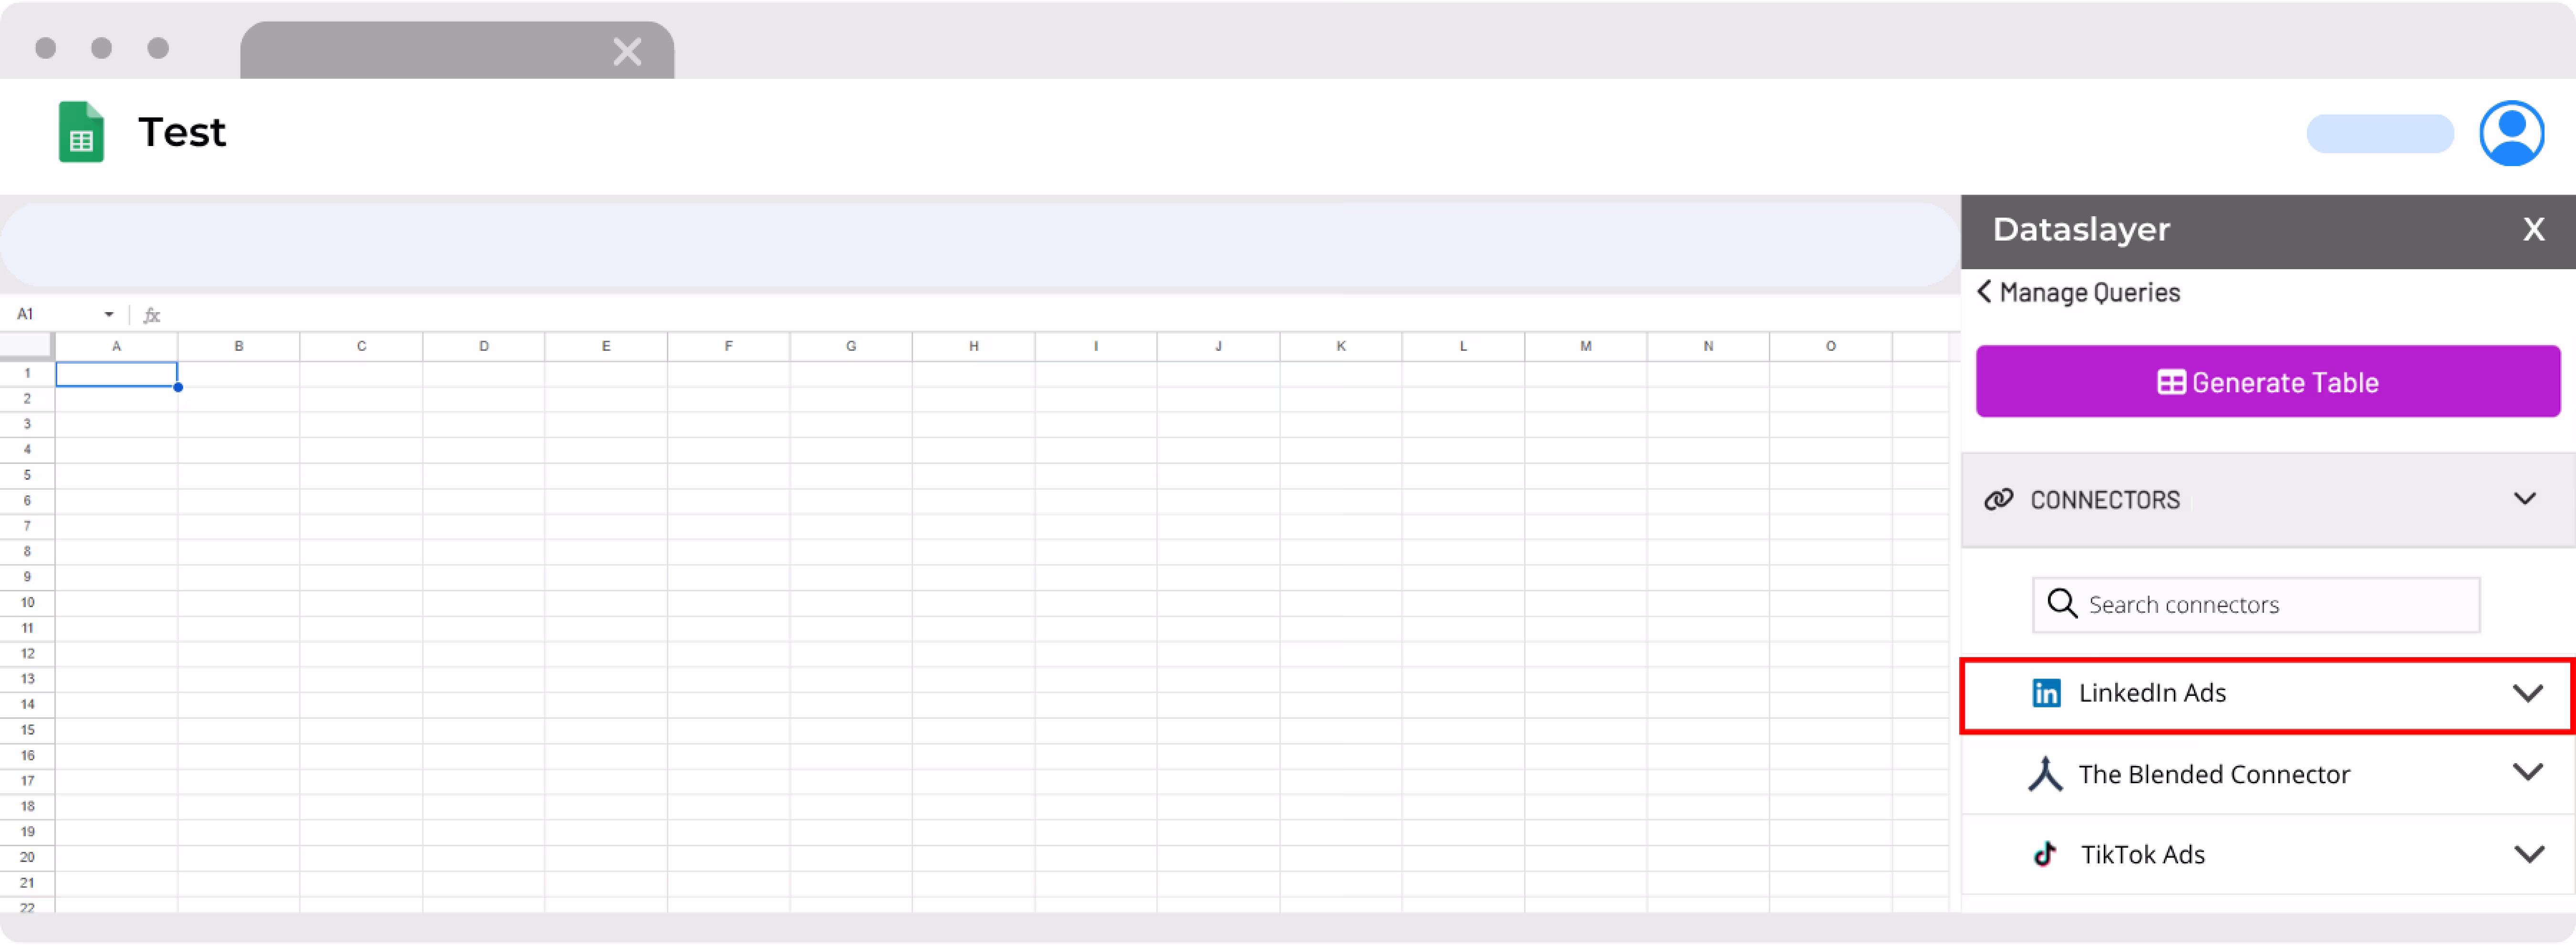
Step 2: Select LinkedIn Ads as Your Data Source
In the Dataslayer sidebar, select LinkedIn Ads from the data source dropdown. If it's your first time, Dataslayer will authenticate your LinkedIn account automatically. If you manage multiple ad accounts, you'll see all available accounts listed.
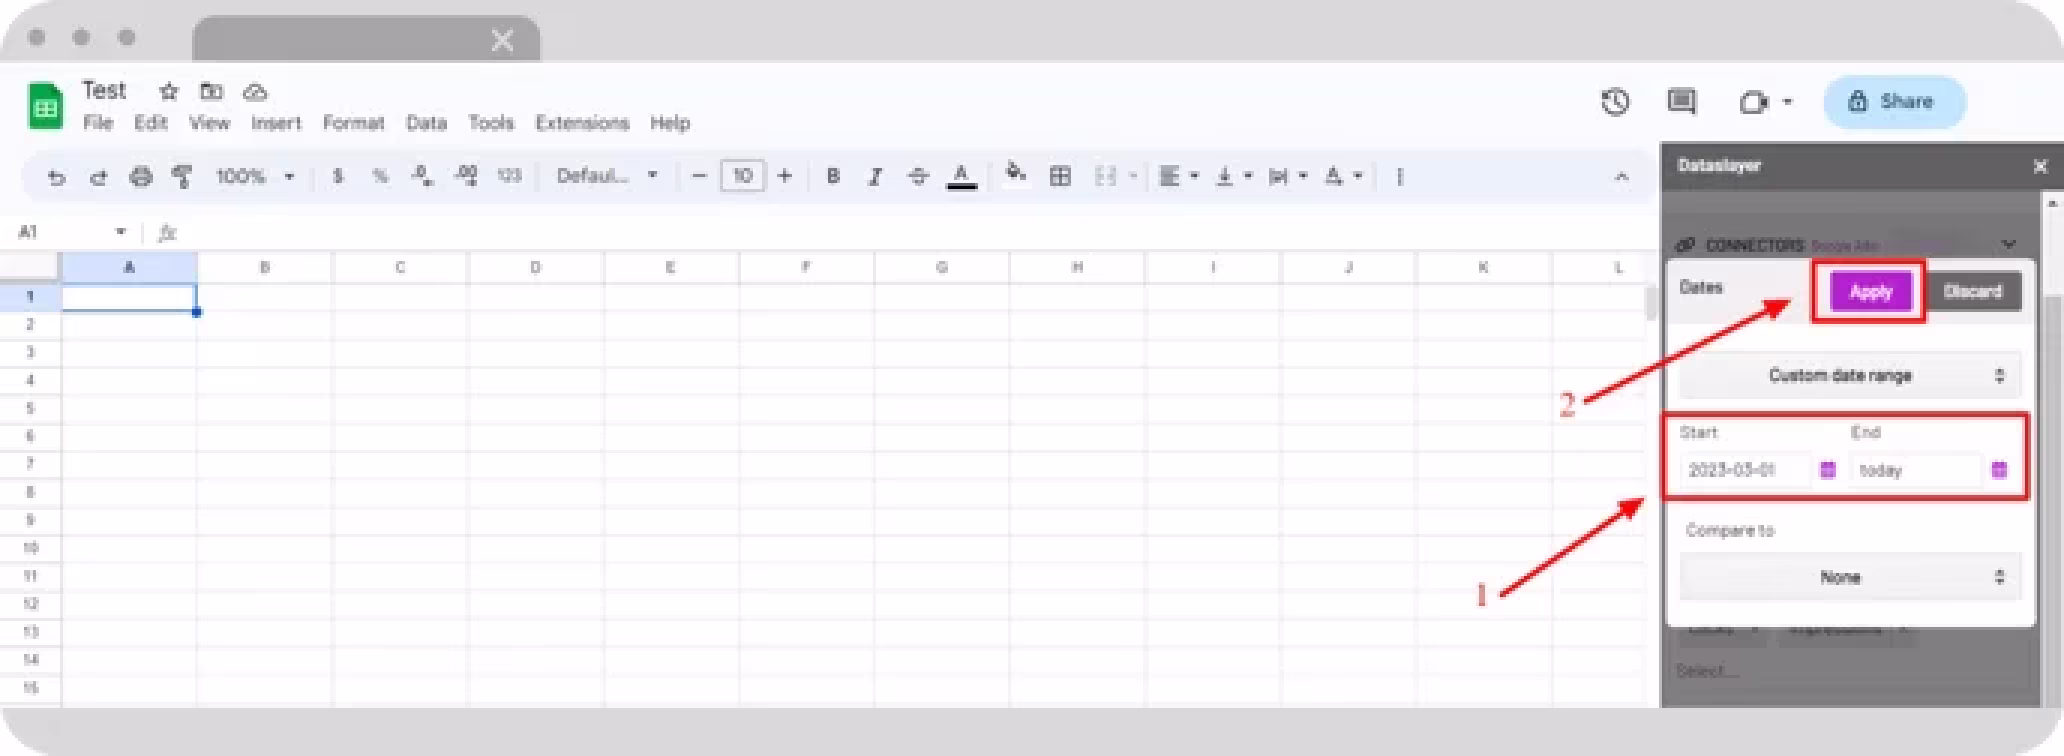
Step 3: Choose Account and Date Range
Select which LinkedIn Ads account(s) you want to pull data from. Then choose your date range: "This month to date," "Last 30 days," "Yesterday," or a custom range.
Step 4: Select Metrics and Dimensions
Pick from 80+ metrics and 65+ dimensions.
For basic tracking, select:
- Dimensions: Date, Campaign Name, Campaign Status
- Metrics: Impressions, Clicks, CTR, Cost, CPC
For lead generation, add:
- Metrics: One Click Leads, Lead Form Opens, Cost per Lead, Qualified Leads
- Dimensions: Creative Headline, Creative Description
For audience analysis, include:
- Dimensions: Company Size, Industry, Seniority, Job Function
- Metrics: Impressions, Clicks, Cost per Lead
Step 5: Configure Advanced Options (Optional)
Set filters if needed (campaign status = active, spend > $100), choose how many decimals to display, or enable "Include empty data" to show all campaigns even with zero metrics.
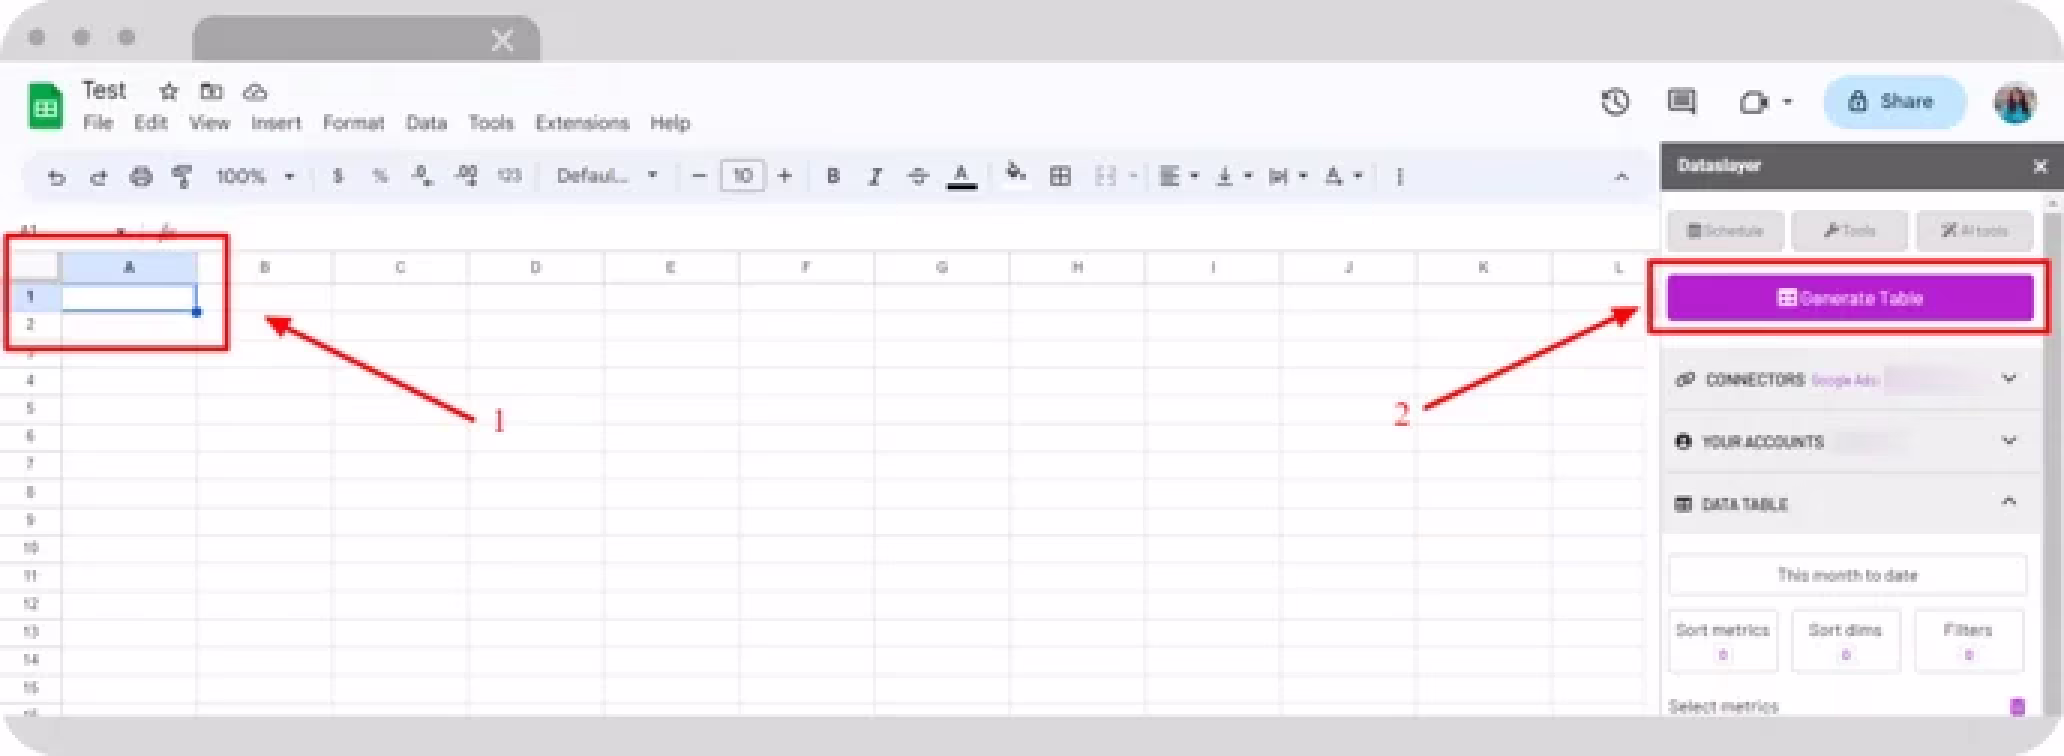
Step 6: Select Destination Cell and Generate
Click on the cell in your Google Sheet where you want the data to appear (usually A1). Then click "Generate Table" in the Dataslayer sidebar. In a few seconds, your LinkedIn Ads data appears formatted and ready to analyze.
Step 7: Schedule Automatic Updates
To automate refreshes, click the Schedule button at the top of the Dataslayer sidebar. Choose your refresh interval: daily, weekly, monthly, or hourly. Click Save. Your data now updates automatically on your chosen schedule.
Real Example: B2B SaaS Company Weekly Reporting
A B2B software company runs LinkedIn Ads across five product lines with a $50,000 monthly budget. Before Dataslayer, their marketing manager spent 4 hours every Monday on manual reporting.
With Dataslayer:
- Setup time: 20 minutes (one-time)
- Weekly maintenance: 0 hours (fully automated)
- Every Monday at 7am, fresh data appears in the shared Google Sheet
- Weekly time saved: 4 hours = 208 hours per year
Beyond time savings, they discovered insights they missed before. Looking at demographic breakdowns (now automated), they found that Director-level prospects in 501-1000 person companies had a 47% lower cost per lead than their overall average. They shifted 30% of budget to target that segment, dropping their blended CPL from $94 to $67.
Combining LinkedIn Ads with Other Platforms
Dataslayer's biggest advantage is cross-platform reporting. If you're running LinkedIn Ads alongside Google Ads, Facebook Ads, or other channels, you can pull everything into one Google Sheet. Similar to our guide on connecting Google Ads to Google Sheets, the process is straightforward and saves hours weekly.
Common multi-platform setups:
- LinkedIn Ads + Google Ads: Compare cost per lead across search and social. One agency found their Google Search CPL was $34 while LinkedIn was $82, but LinkedIn leads closed at 3x the rate, making the real cost per customer actually lower for LinkedIn.
- LinkedIn + Facebook + Google Ads: See which platform drives awareness (impressions), engagement (clicks), and conversions. Most B2B companies find LinkedIn drives fewer clicks but higher-quality conversions.
- LinkedIn Ads + CRM: Connect ad spend to closed revenue. Calculate true ROAS, not just cost per lead. Learn more about cross-platform reporting in Google Sheets.
Common Issues and Solutions
"My Data Doesn't Match Campaign Manager"
Time zone mismatch: Campaign Manager uses your account time zone. Your export might default to UTC.
Attribution window differences: LinkedIn attributes conversions within a 90-day window by default. If you changed this setting, exports reflect the new window but historical data doesn't update.
Deleted campaigns: Campaign Manager hides deleted campaigns unless you select "Show archived."
"Conversion Data Is Missing"
LinkedIn only exports conversion data if you've set up conversion tracking. Install the LinkedIn Insight Tag on your website and create conversion goals in Campaign Manager.
Common mistake: Installing the tag but not defining conversions. You need to tell LinkedIn what counts as a conversion (form submission, purchase, download).
"My Sheet Is Too Slow"
Google Sheets has a 10 million cell limit per spreadsheet. Beyond 500,000+ cells with complex formulas, performance degrades.
Fix 1: Archive old data (anything older than 90 days).
Fix 2: Use QUERY() instead of VLOOKUP(), it processes server-side.
Fix 3: Import only the metrics you need. Each extra column multiplies file size.
Frequently Asked Questions
Can I pull LinkedIn Ads data into Google Sheets for free?
Yes, manual CSV exports are free and unlimited. If you want automation, LinkedIn's API is free for basic use (100 requests/day), but requires coding knowledge. Third-party tools cost $50-200/month depending on data volume.
How often does LinkedIn Ads data update?
Campaign Manager updates metrics in near real-time (15-30 minute delay). However, conversion data can take up to 24 hours to fully populate, especially for web conversions tracked via the Insight Tag.
What metrics can I export from LinkedIn Ads?
LinkedIn provides 60+ metrics including impressions, clicks, spend, conversions, video views, engagement (likes, comments, shares), demographic breakdowns, and placement performance. Not all metrics export by default, customize columns in Campaign Manager or specify metrics in API calls.
Why are my LinkedIn Ads dates showing as text in Google Sheets?
LinkedIn exports dates in MM/DD/YYYY format as text strings, not date values. Convert them using =DATEVALUE(A2) where A2 is your date cell, then drag the formula down.
Can I combine LinkedIn Ads data with Google Ads or Facebook Ads in one Sheet?
Yes. If pulling data manually, export CSVs from each platform and combine them with formulas like QUERY(). Automation tools let you connect multiple ad platforms to one Google Sheet, creating a unified dashboard showing cross-channel performance and ROI comparisons.
How far back can I pull historical LinkedIn Ads data?
Campaign Manager stores 12 months of data in the interface by default, but you can access up to 2 years via the API. If you need older data, check your past CSV exports.
What's the difference between exporting campaign-level vs. ad-level data?
Campaign-level shows aggregated metrics for each campaign (total impressions, spend, conversions). Ad-level breaks down performance by individual ads within campaigns, letting you see which creatives perform best. Ad-level data creates larger files, one campaign with 10 ads generates 10 rows instead of 1.
Next Steps: Choose Your Method
If you report monthly and manage 1-2 accounts: Stick with manual CSV exports. Bookmark this guide for the date formatting fixes.
If you're technical and need custom dashboards: Build an Apps Script or Python solution using the LinkedIn Marketing API. Budget 1-2 days for setup.
If you report weekly/daily or pull data from multiple platforms: Automation saves 5-10 hours per month. Try Dataslayer free for 15 days to connect LinkedIn Ads (plus Google Ads, Facebook Ads, and 50+ other sources) to Google Sheets, Looker Studio, BigQuery, or Power BI.
The goal isn't perfection, it's getting your data where you can actually use it.


