
Updated: April, 2026
The LinkedIn algorithm changed dramatically entering 2026. If you're seeing less engagement on posts that used to perform well, you're not alone. Views are down 50%, engagement down 25%, and follower growth down 59% compared to last year, according to Richard van der Blom's Algorithm Insights 2025 Report.
But while overall reach is dropping, specific content formats are crushing it. Document posts (PDF carousels) are hitting 6.60% engagement rates, the highest of any LinkedIn format. Meanwhile, standard text posts struggle to break 2%.
Whether you're building thought leadership, generating leads, recruiting talent, or growing your personal brand, the strategies that worked in 2024 aren't cutting it anymore. The professionals winning on LinkedIn in 2026 aren't posting more frequently. They're using formats the algorithm rewards and tracking what actually drives results.
What Changed in the LinkedIn Algorithm (Early 2026)
LinkedIn's ranking system shifted from rewarding viral reach to what they call "Depth and Authority." According to LinkedIn's official guidance on content distribution, here's what the algorithm prioritizes now:
Dwell Time Over Likes
The algorithm measures how long people actually engage with your content, not just whether they clicked. A post someone reads for 30 seconds outperforms one with 50 quick likes. The system now detects "click bounces," where people click but leave immediately, and deprioritizes that content.
External Links Get Penalized
Posts with links to external websites see approximately 60% less reach than identical posts without links. The "link in first comment" workaround? Also penalized as of early 2026.
Expertise and Niche Authority
The algorithm identifies your "topic DNA" and distributes content based on demonstrated expertise rather than network size. Educational posts with frameworks and data get amplified to users interested in that specific topic, even if they're not in your network.
First 60 Minutes Are Critical
LinkedIn tests new posts with 2-5% of your network initially. How this small group engages determines wider distribution. Only 5% of underperforming posts in the first hour recover to reach broader audiences.
The Formats Dominating Engagement in 2026
1. Document Posts (PDF Carousels)
Benchmark: 6.60% average engagement, the highest of any LinkedIn format.
Since LinkedIn removed native carousel uploads in December 2023, multi-page PDFs became the workaround. They're now the dominant format for engagement across industries:
- 278% more engagement than video
- 596% more than text-only posts
- 303% more than single images
Our testing: At Dataslayer, document posts achieved 40.5% engagement versus 10.7% for other formats, nearly 4x the performance. Similar results appear across industries when professionals share frameworks, data insights, and educational content their audience saves for reference.
Why they work:
- Higher dwell time (each swipe extends engagement)
- Mobile-optimized (maximum screen real estate)
- Save-worthy (people bookmark valuable content)
- Completion tracking (LinkedIn measures how many slides people view)
Best practices:
- Keep it 5-10 slides (engagement drops after slide 10)
- Use 1080x1080px (square) or 1080x1350px (portrait)
- Export as PDF for cross-device consistency
- Start with a strong hook slide stating clear value
- One key takeaway per slide
- End with a clear CTA (comment, save, DM)
Top-performing topics across industries:
- Step-by-step frameworks and processes
- Data visualizations and industry benchmarks
- Before/after transformations (career, sales, projects)
- Tool/platform tutorials with screenshots
- Myth-busting posts with evidence
- Career lessons and professional insights
Examples by profession:
- Recruiters: "5-Step Hiring Process That Reduced Time-to-Hire by 40%"
- Consultants: "Client Onboarding Framework That Gets 95% Satisfaction"
- Sales professionals: "Discovery Call Script That Doubled My Close Rate"
- Founders: "Product Launch Checklist: What We Wish We'd Known"
- Marketers: "Campaign Performance Benchmarks by Industry"
2. Native Video (30-90 Seconds)
Benchmark: 5.60% engagement
Video views on LinkedIn grew 36% year-over-year, and video content creation is growing 2x faster than other formats, according to LinkedIn's Marketing Solutions Blog. LinkedIn is clearly prioritizing video with new features like "Videos For You" personalized feeds and full-screen mobile mode.
Optimal specs:
- Length: 30-90 seconds (sweet spot for completion rate)
- Format: 1:1 square or 9:16 vertical for mobile
- Always include captions (91% watch muted by default)
- Native uploads outperform YouTube embeds
Content that works across professions:
- Quick industry takes or reactions to news (30-60 seconds)
- Behind-the-scenes moments (authentic beats polished)
- Product or service demos showing specific use cases
- Personal insights from experience
- Quick tips or advice (60-second format)
Examples by profession:
- Recruiters: "Red flags I spotted in this resume in 10 seconds"
- Consultants: "Client asked me this yesterday, here's what I said"
- Sales professionals: "Objection handling: What I learned after 200 demos"
- Founders: "Here's our startup office after 6 months, real talk"
3. Strategic Text Posts
Benchmark: 2-4% engagement
Text posts still work when they deliver genuine value. The key is structure and immediate relevance.
First 150 characters matter most (before "See more"):
❌ Generic: "Excited to share some insights about leadership"
✅ Specific: "I lost my best employee yesterday. Here's the conversation I wish I'd had 6 months ago"
Structure that works:
- Hook (data point, contrarian take, specific problem)
- Short paragraphs (3-4 lines maximum)
- One clear, actionable takeaway
- CTA (question or invitation to engage)
Critical: No external links in text posts. Put links in first comment if absolutely necessary, but expect reduced reach regardless.
Content themes that perform:
- Personal career lessons and failures
- Contrarian takes on industry practices
- Specific problems and how you solved them
- Behind-the-scenes insights from your work
- Data-driven observations from your experience
4. LinkedIn Newsletters
Newsletters are the most underused LinkedIn format, and the one that beats the algorithm entirely. While regular posts compete for feed visibility, newsletter editions are delivered directly to subscribers' inboxes and notification tabs.
Why newsletters matter in 2026:
- Direct delivery — every edition triggers a push notification and email to all subscribers. No algorithm filtering.
- Subscriber growth is built-in — LinkedIn prompts profile visitors and connections to subscribe automatically.
- New metrics — LinkedIn added email sends and email open rate tracking, giving you visibility into actual delivery and engagement beyond the feed.
- Sponsored newsletters — LinkedIn now supports promoting newsletters through ads, expanding reach beyond organic.
- SEO value — newsletter articles are indexed by Google, creating an additional organic traffic channel.
Best practices:
- Publish on a consistent schedule (weekly or biweekly)
- Each edition should deliver standalone value, not just link to your blog
- Use the first 2-3 lines as a hook (they appear in the notification)
- Include a clear CTA at the end (download, register, reply)
Newsletters work especially well for B2B thought leadership, industry analysis, and recurring data-driven content, exactly the kind of content the algorithm rewards when shared as regular posts too.
What We See on Dataslayer's LinkedIn (Our Own Data)
We track our own LinkedIn Pages data with Dataslayer, and the patterns match the industry benchmarks almost exactly:
- Document posts consistently generate the highest click-through rates — roughly 5x higher than image posts and over 10x higher than posts with external links.
- Posts with external links perform the worst — even when promoting valuable content like our newsletter or blog articles, link posts get dramatically less engagement than any native format.
- Video works for reach, not clicks — our video posts get solid impressions but significantly fewer clicks than documents. They're effective for brand visibility, not for driving traffic.
- Team and culture posts get the most impressions — but educational content (frameworks, checklists, common mistakes) drives the most meaningful engagement.
The takeaway: if you're still defaulting to link posts to promote your blog, you're leaving engagement on the table. Repurpose that content as a native document or carousel instead.
Timing and Frequency: What Actually Works
Company pages: 3-5 posts per week
More frequent posting causes your content to compete with itself in followers' feeds.
Personal profiles: Daily posting is acceptable
Individual profiles have more flexibility, but only if quality stays high.
Best times (general professional audience):
- Peak: Wednesday at 9 AM
- Strong: Tuesday-Thursday, 8-10 AM in your audience's timezone
- Avoid: Weekends and Monday mornings
The critical mistake: Posting just to "stay active." The 2026 algorithm aggressively penalizes low-quality content. One valuable post per week outperforms five forgettable ones.
What to Avoid in 2026
- External links in posts → approximately 60% reduction in reach
- Generic "bro-etry" (one-line paragraphs, empty platitudes) → Classified as spam
- AI-generated generic content → Algorithm detects pattern-matching against known AI styles
- Engagement bait ("Agree? Comment 👇") → Explicitly listed as spam behavior
- Excessive hashtags → 3-5 relevant tags maximum, preferably in first comment
How to Know Which Format Works for You
You just learned document posts get 6.6% average engagement, but will they work for YOUR specific audience in YOUR niche?
Here's how professionals actually test this:
- Week 1-2: Post 2 document carousels, 2 text posts, 1 video
- Track: Engagement rate, saves, profile visits for each format
- Week 3-4: Double down on the winning format
- Week 5-6: Test variations of your winning format
The problem is manually tracking this across formats, topics, and posting times takes 2-3 hours weekly. You're exporting CSVs, copying into spreadsheets, calculating engagement rates, and comparing week-over-week trends.
Automate It in 2 Minutes
Connect LinkedIn to Google Sheets or Looker Studio once, get automatic updates daily:
What you'll see:
- Engagement rate by post format (documents vs text vs video)
- Which topics drive the most saves and shares (the metrics that matter in 2026)
- Your best posting times based on 90 days of YOUR data
- Posts that hit over 10% engagement (your templates for future content)
- Profile visits driven by each post type
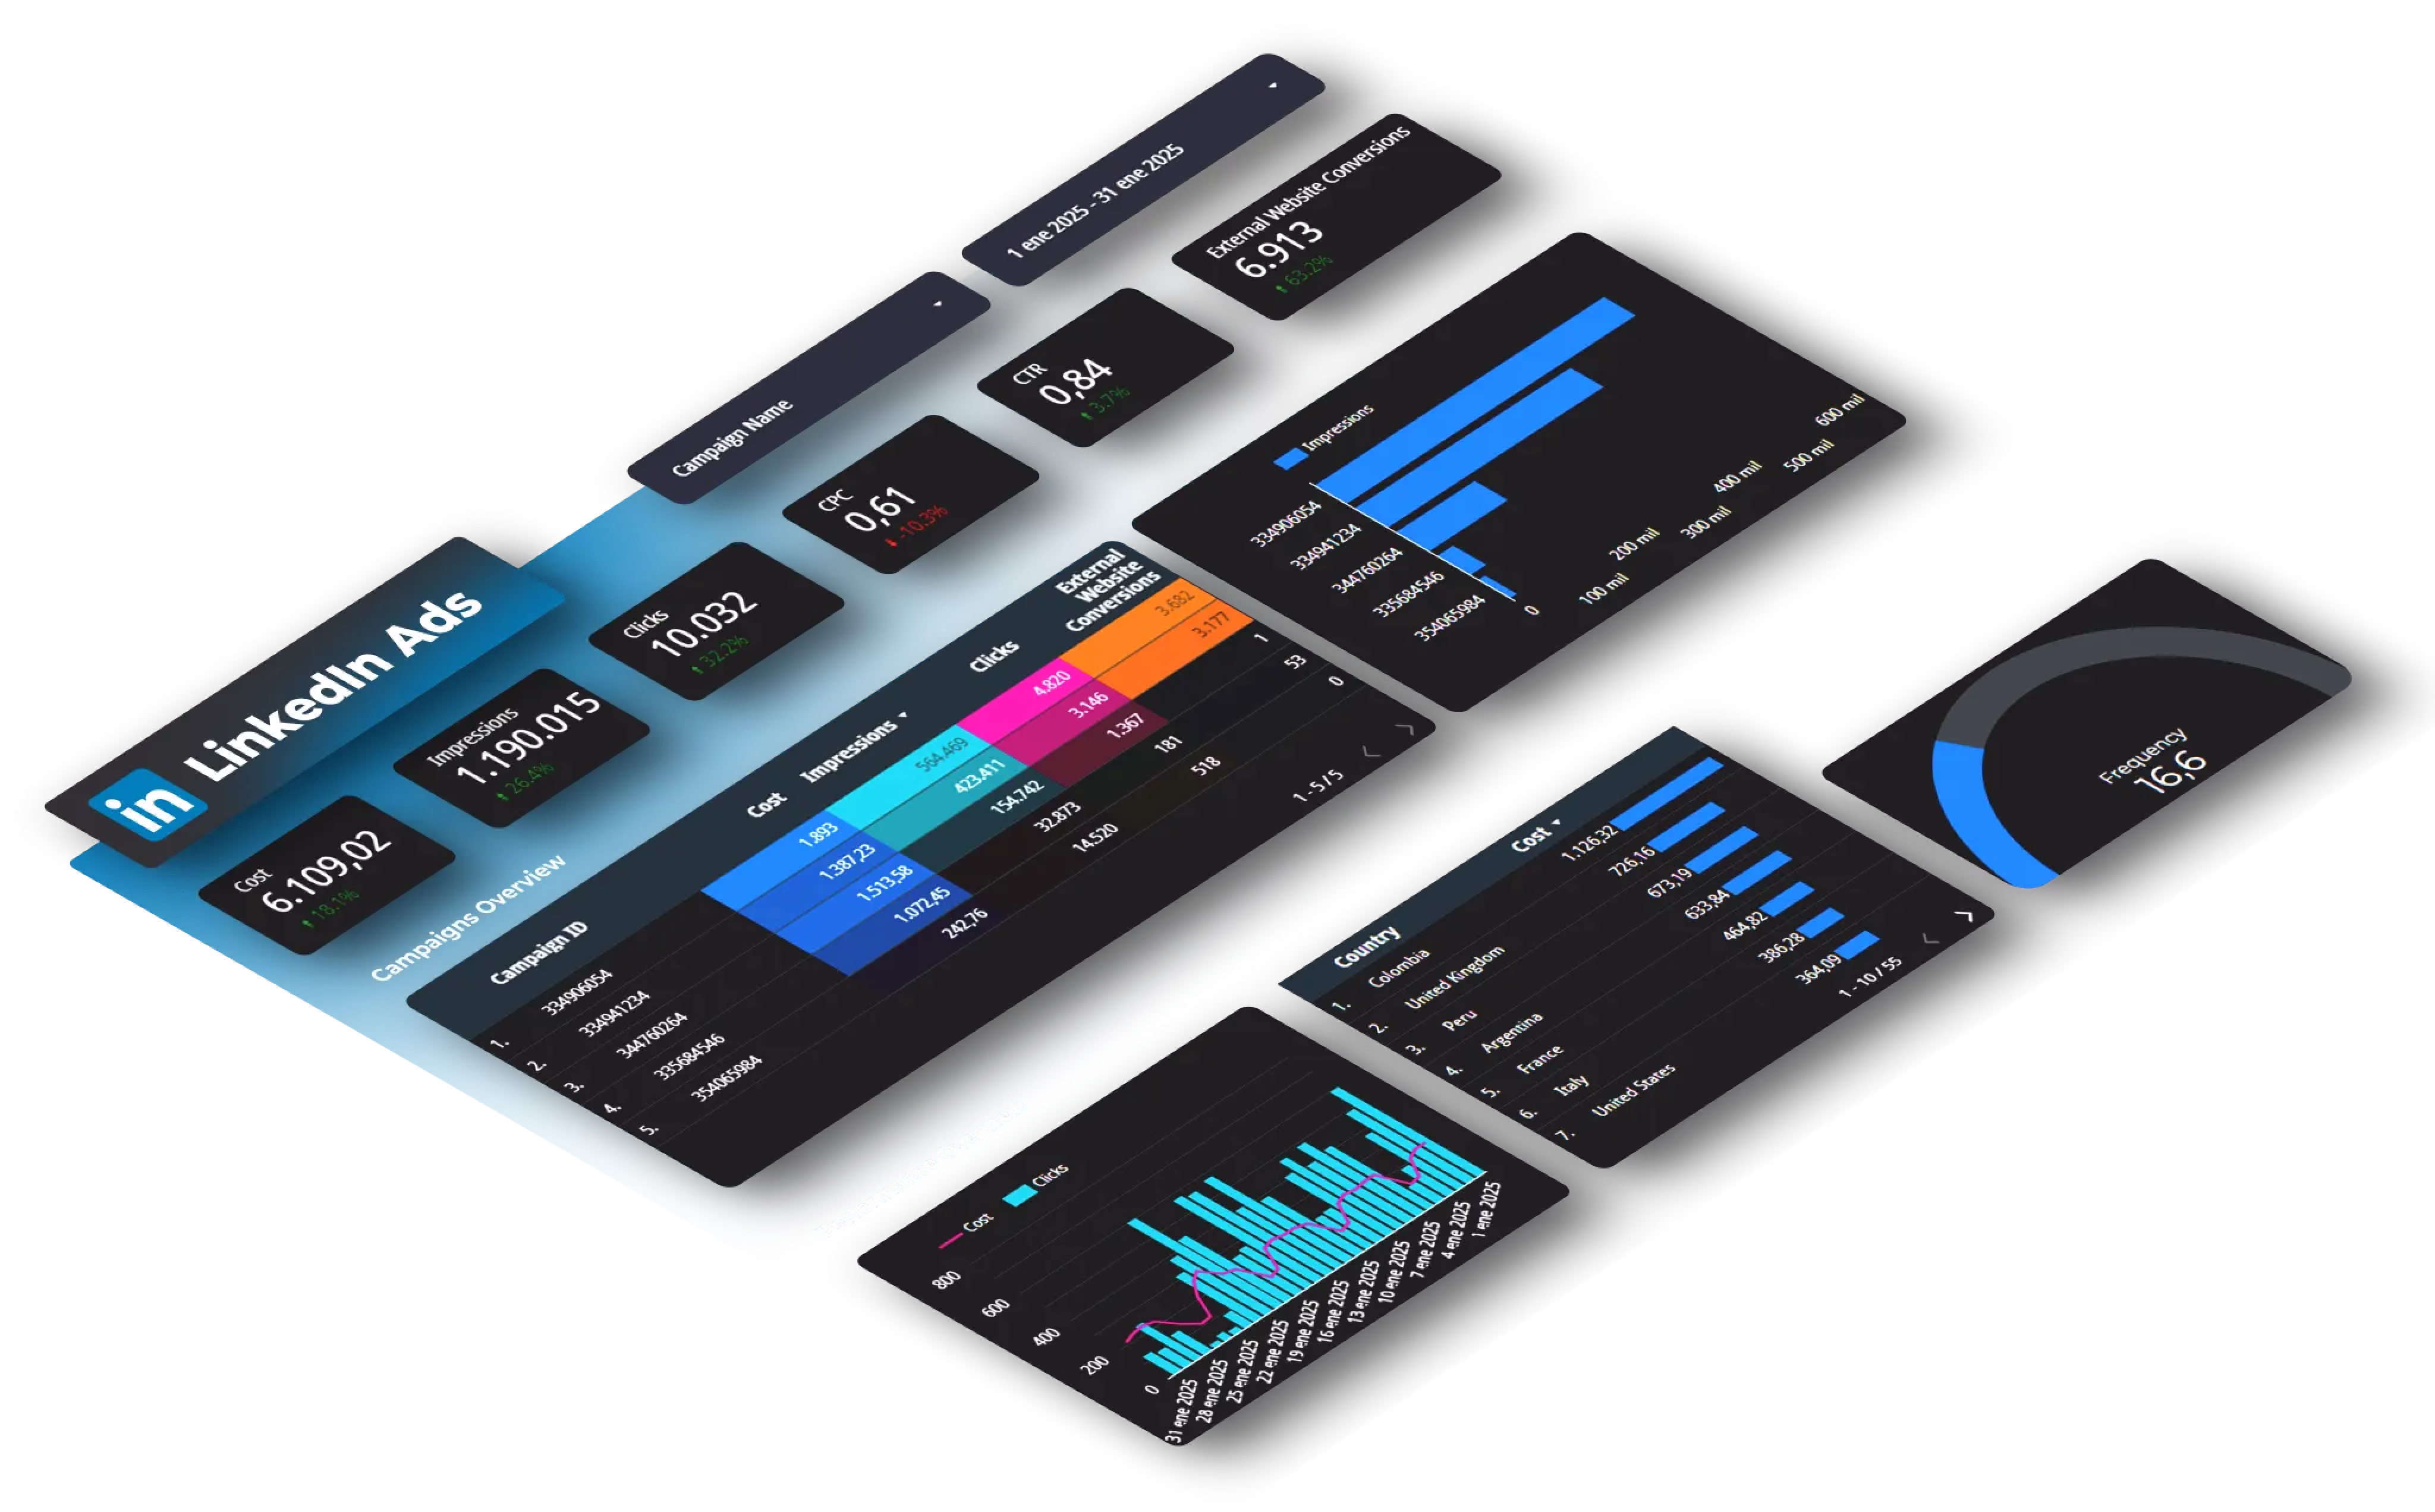
Example dashboard view:
With this data, you'd know to focus on documents and understand exactly which topics within that format perform best.
Conclusion: The 2026 LinkedIn Strategy
The LinkedIn algorithm rewards substance over frequency, depth over virality, and expertise over engagement hacking.
Your action plan:
✅ Prioritize document posts (6.6% average engagement, up to 40%+ in engaged niches)
✅ Create short native videos (30-90 seconds, growing 2x faster than other formats)
✅ Write strategic text posts (strong hooks, clear structure, no external links)
✅ Post 3-5 times weekly maximum (quality beats quantity)
✅ Engage in the first 60 minutes (reply to comments, ask follow-up questions)
✅ Track performance with data (identify patterns, optimize continuously)
The algorithm changes constantly, but one principle remains: create content your specific audience finds genuinely valuable. Everything else is tactics.
Frequently Asked Questions
Q: What type of content gets the most engagement on LinkedIn in 2026?
Document posts (PDF carousels) lead with a 6.60% average engagement rate, the highest of any LinkedIn format. Native video follows at 5.60%. Text-only posts average around 2%, and posts with external links see approximately 60% less reach than posts without them.
Q: Are LinkedIn newsletters worth starting in 2026?
Yes. Newsletters bypass the feed algorithm entirely — every edition is delivered directly to subscribers via push notification and email. LinkedIn also added email open rate tracking and now supports sponsored newsletters. They work especially well for B2B thought leadership and recurring data-driven content.
Q: How often should I post on LinkedIn in 2026?
Quality beats frequency. The algorithm now rewards depth and expertise over posting volume. One valuable post per week consistently outperforms five forgettable ones. If you publish more, focus on your top-performing format and avoid filler content that dilutes your topic authority.
Q: Does LinkedIn penalize posts with external links?
Yes. Posts with links to external websites see approximately 60% less reach than identical posts without links. The workaround of putting the link in the first comment is also penalized as of early 2026. If you need to drive traffic, consider sharing the key content natively and mentioning the link in comments.
Q: What is dwell time and why does it matter for LinkedIn?
Dwell time measures how long someone actually spends reading or viewing your content. The LinkedIn algorithm now prioritizes dwell time over surface-level engagement like likes. A post someone reads for 30 seconds outperforms one with 50 quick likes. This is why document posts and long-form video perform well — they naturally hold attention longer.


