Dataslayer Data Warehouse is coming!
All your data centralized in one place. Be the first to try it.
New Salesforce Connector!
Import your CRM and sales data directly into your favorite reporting tools.


Enjoy a 15-day free trial to explore everything the Amplitude Connector can do!

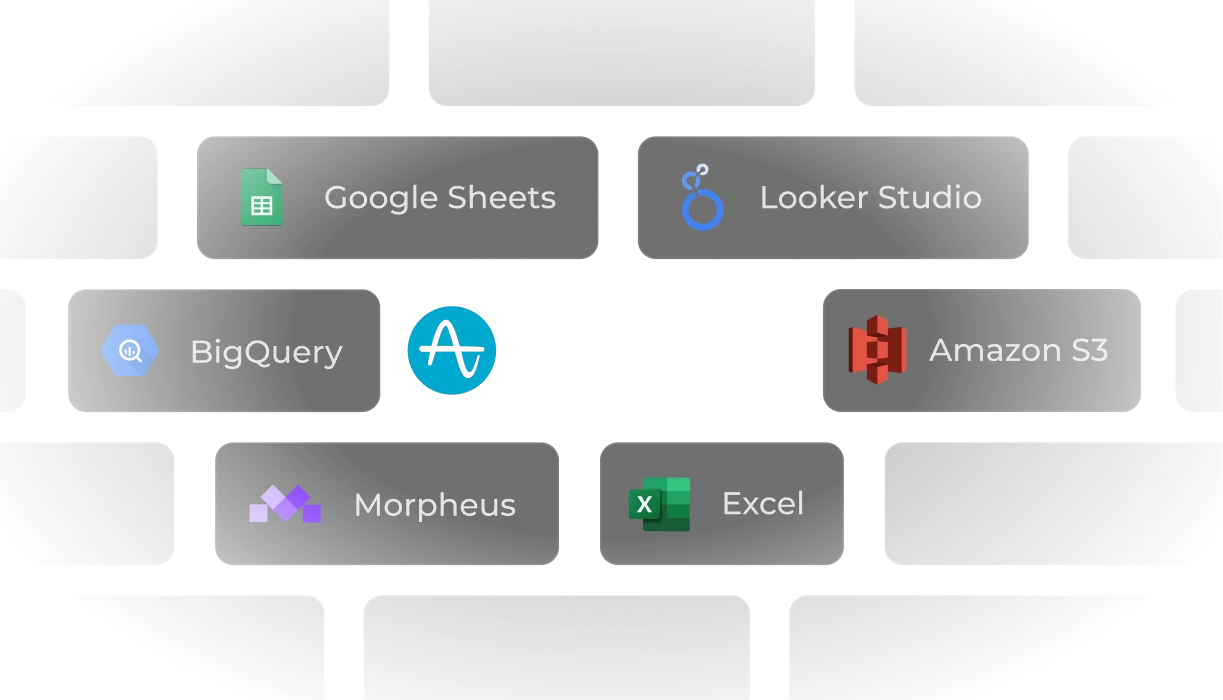
The Amplitude connector simplifies your analytics reporting by automating data extraction into Google Sheets, Data Studio, and Power BI. Monitor user behavior, traffic trends, and performance metrics in real time, enabling faster, data-driven decisions for your business.
Keep working your way. Automatically move all your marketing data to your preferred spreadsheets, databases, or BI tools.


Analyze, optimize, and forecast your data with Marketing Mix Modeling to maximize campaign impact.
Push marketing data into Azure Blob Storage for scalable cloud archival and analytics.
Sync marketing data into Azure SQL Database for centralized warehousing and analytics.
Stream campaign insights directly into GCS; create foundation for BigQuery analytics.
Connect to MySQL, PostgreSQL, SQL Server, Oracle DB, or MariaDB with zero setup.
Consolidate data from various sources into a petabyte-scale data warehouse.
Store data from 40+ connectors in your S3 bucket; simplify marketing data sending.
Import data from over 50 sources directly into Snowflake, transforming it into a centralized hub.
Store campaign data from 40+ sources; automate reports and save time.
Import in seconds your marketing data into Power BI, QLIK, AWS, Tableau and more.
Transform data into insights using over 40 connectors with Power BI integration.
Import campaign data faster and save time with reporting for Data Studio (formerly Looker Studio).
Seamlessly import marketing data from various sources into Excel for analysis and reporting.
Import all your campaign data from Facebook, TikTok, Bing, Google Ads, DV360, Google Analytics, and more.

The Amplitude integrates seamlessly with tools like Google Sheets, Data Studio, Power BI, and more. Effortlessly export your data to keep track of all your campaigns, all in one place.

Create custom reports with the metrics and dimensions that matter most. Analyze your campaign performance and audience behavior to make data-driven decisions that optimize marketing strategies.

No more manual updates! The Amplitude Connector automates data synchronization, ensuring your reports are always up to date. Focus on improving marketing performance instead of pulling data.

Transform your data into visually compelling dashboards using tools like Data Studio and Power BI. Monitor key metrics such as open rates, click-through rates, and audience segmentation to maximize your ROI.

With the Amplitude Connector, schedule automatic data refreshes to ensure you always have the latest insights without any manual effort.

Follow these steps to connect your Amplitude Connector account to Dataslayer:


With the Amplitude connector, you can track critical product analytics and user behavior KPIs, including Event Counts, Active Users (DAU, WAU, MAU), Session Frequency, Average Session Duration, and Funnel Conversion Rates.
Yes. You can break down your behavioral charts using dimensions such as User Properties, Device Type, Platform (iOS, Android, Web), Country, and specific User Cohorts to identify which segments engage the most.
You can seamlessly export and schedule automatic refreshes for your product analytics data directly into Google Sheets, Looker Studio, Power BI, and Google BigQuery.


