Dataslayer Data Warehouse is coming!
All your data centralized in one place. Be the first to try it.
New Salesforce Connector!
Import your CRM and sales data directly into your favorite reporting tools.

Enjoy a 15-day free trial to explore everything the X Insights Connector can do!


The X Insights connector streamlines the way you analyze organic performance data by automatically syncing key metrics into Google Sheets, Data Studio, and Power BI. Track engagement, follower growth, content reach, and other critical indicators to refine your organic strategy and build stronger connections with your audience.
Keep working your way. Automatically move all your marketing data to your preferred spreadsheets, databases, or BI tools.


Analyze, optimize, and forecast your data with Marketing Mix Modeling to maximize campaign impact.
Push marketing data into Azure Blob Storage for scalable cloud archival and analytics.
Sync marketing data into Azure SQL Database for centralized warehousing and analytics.
Stream campaign insights directly into GCS; create foundation for BigQuery analytics.
Connect to MySQL, PostgreSQL, SQL Server, Oracle DB, or MariaDB with zero setup.
Consolidate data from various sources into a petabyte-scale data warehouse.
Store data from 40+ connectors in your S3 bucket; simplify marketing data sending.
Import data from over 50 sources directly into Snowflake, transforming it into a centralized hub.
Store campaign data from 40+ sources; automate reports and save time.
Import in seconds your marketing data into Power BI, QLIK, AWS, Tableau and more.
Transform data into insights using over 40 connectors with Power BI integration.
Import campaign data faster and save time with reporting for Data Studio (formerly Looker Studio).
Seamlessly import marketing data from various sources into Excel for analysis and reporting.
Import all your campaign data from Facebook, TikTok, Bing, Google Ads, DV360, Google Analytics, and more.

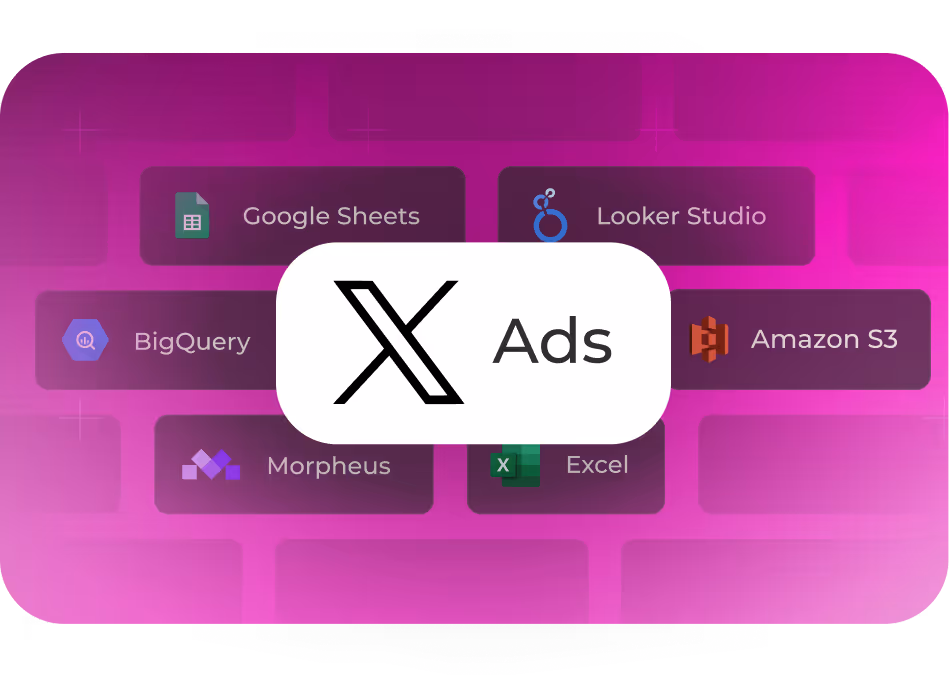
The X Insights Connector integrates seamlessly with tools like Google Sheets, Data Studio, Power BI, and more. Effortlessly export your data to keep track of all your campaigns, all in one place.

Create custom reports with the metrics and dimensions that matter most. Analyze your campaign performance and audience behavior to make data-driven decisions that optimize marketing strategies.

No more manual updates! The X Insights Connector automates data synchronization, ensuring your reports are always up to date. Focus on improving marketing performance instead of pulling data.

Transform your data into visually compelling dashboards using tools like Data Studio and Power BI. Monitor key metrics such as open rates, click-through rates, and audience segmentation to maximize your ROI.

With the X Insights Connector, schedule automatic data refreshes to ensure you always have the latest insights without any manual effort.

Getting started with the X Insights Connector is simple. Follow these steps to connect your X Insights Connector account to Dataslayer:


The X Insights Connector (formerly Twitter Insights) allows you to access all the essential organic performance data from your X account. You can track impressions, engagements, likes, retweets, replies, profile visits, link clicks, and follower growth. For video posts, you can also analyze video views, completion rates, and average watch time. These metrics are vital for brands and content creators who want to evaluate the performance of their organic content and optimize their strategy on X.
Yes. With the X Insights Connector, you can break down data at both the post level and the account level. At the post level, you can evaluate impressions, clicks, and engagement for each tweet or video. At the account level, you can monitor follower growth, overall engagement rate, and visibility trends. This dual perspective helps you understand which individual posts drive the most impact and how your account is performing over time.
Absolutely. The X Insights Connector provides audience insights that include follower demographics such as age, gender, interests, language, and geography. You can identify which audience segments are engaging most with your content and whether your posts are reaching the right people. These insights are particularly useful for refining content strategies and ensuring alignment with your target audience.
Yes. One of the most valuable features of the X Insights Connector is the ability to track follower trends alongside engagement. You can see how many new followers you gain or lose over time, monitor spikes in growth linked to specific content, and compare engagement trends across different time periods. This information is key to building a loyal community and understanding what content fosters audience growth.
Dataslayer’s X Insights Connector allows you to report on where your audience is located and which devices they are using to engage with your content. You can break down results by country, region, or city, as well as by device type (desktop, mobile web, or mobile app). These breakdowns help you understand how consumption varies across markets and platforms, ensuring you adapt content formats and posting strategies accordingly.
The X Insights Connector integrates seamlessly with all Dataslayer destinations. You can export your organic performance data into Google Sheets or Excel for quick analysis, build dashboards in Data Studio or Power BI to track engagement and follower growth, or store the data in BigQuery, Snowflake, Amazon Redshift, or Amazon S3 for large-scale reporting. Developers can also use the API Query Manager to automate workflows and combine X Insights data with X Ads or other marketing platforms.
Like all Dataslayer connectors, the X Insights Connector is included in every subscription plan. Pricing is based only on usage: the number of API calls or rows processed in your reporting destination, and the number of accounts you connect. There are no additional connector fees, so you can easily combine X Insights data with X Ads, Google Ads, or TikTok Insights under the same plan without extra costs.
Dataslayer provides comprehensive setup guides, tutorials, and best practices in the Knowledge Base to help you connect your X account and start reporting. If you need more personalized assistance, our support team is available via live chat and email to help troubleshoot, advise on automation, and share strategies for organic growth. This ensures you get the most out of your X Insights Connector and continuously improve your performance on the platform.


