
Marketing teams waste $37 billion annually on misattributed ad spend. Google Ads claims 150 conversions. Facebook says 89. LinkedIn reports 34. Your CRM shows 180 actual customers.
The math doesn't work because each platform counts the same customer multiple times using last-click attribution. Cross channel analytics solves this by tracking real customer journeys across platforms, showing which channels work together to drive conversions, not just which one gets the final click.
What Is Cross Channel Analytics? (And Why It's Not Just Multi-Channel Reporting)
Cross channel analytics measures how different marketing channels interact and influence each other throughout the customer journey. Unlike multi-channel reporting, which treats each platform as an independent silo, cross channel analytics reveals the relationships between touchpoints.
The difference:
Multi-channel reporting tells you Google Ads generated 150 conversions at $45 CPA and Facebook generated 89 conversions at $52 CPA. Two separate numbers.
Cross channel analytics reveals that 67% of people who converted through Google Ads had previously seen your Facebook ad. Suddenly, Facebook isn't just getting 89 conversions, it's assisting on 101 additional conversions that Google Ads gets credit for.
This matters because according to Google's research on customer journeys, the average customer now interacts with 6 to 8 touchpoints before converting. Measuring channels in isolation means you're blind to 5 to 7 interactions that influenced every sale.
The Evolution: From Single-Touch to Cross Channel
Single-channel analytics (pre-2010): Each platform reported its own numbers with no connection between them.
Multi-channel analytics (2010 to 2018): Marketers pulled data from multiple platforms into spreadsheets or dashboards, but each channel was still measured independently.
Cross-channel analytics (2018 to present): Technology now tracks how channels influence each other. You see that TikTok viewers are 3.2x more likely to convert through Google Search.
Omnichannel analytics (emerging): Creates unified customer experiences. If someone adds a product to cart on mobile, sees a retargeting ad on desktop, and purchases in-store, the full journey connects.
Most marketing teams are still stuck in the multi-channel phase, making budget decisions based on incomplete information.
Why Cross Channel Analytics Matters More in 2026
Three major shifts make cross channel analytics essential:
- Third-party cookie deprecation forces new tracking methods. Chrome's cookie phase-out means you can't rely on user-level tracking across all websites. Cross channel analytics uses first-party data, probabilistic modeling, and aggregated insights to connect customer journeys without violating privacy regulations.
- Walled gardens hide user-level data. Facebook, TikTok, Amazon, and LinkedIn don't share individual user data with third parties. Cross channel analytics aggregates campaign-level data and uses pattern recognition to identify channel interactions.
- Rising acquisition costs demand efficiency. When customer acquisition costs continue climbing, you can't afford to misattribute conversions or waste budget on channels that appear ineffective but actually assist conversions.
The Three Pillars of Effective Cross Channel Analytics
1. Unified Data Collection Across All Touchpoints
You need consistent tracking across every channel:
Digital paid: Google Ads, Facebook/Instagram, LinkedIn, TikTok, Twitter/X, Pinterest, Reddit
Organic digital: Google Analytics 4, organic social, email platforms (Mailchimp, HubSpot, Klaviyo), SEO performance
E-commerce and revenue: Shopify, WooCommerce, Stripe, CRM systems
Offline (if applicable): Call tracking, in-store purchases, direct mail response codes
The challenge: Each platform uses different formats. Facebook Ads shows dates as MM/DD/YYYY. Google Ads uses YYYY-MM-DD. One calls it "conversions," another "purchases," a third "transactions."
Without normalization, you're comparing apples to oranges.
Three approaches:
- Manual export and cleanup: Download CSVs, standardize in Excel/Sheets, combine manually. Takes 5 to 10 hours weekly for 6 to 8 platforms.
- Custom data pipeline: Build API connections, write transformation scripts, maintain as platforms change APIs. Requires data engineering and 2 to 3 months initial build.
- Automated integration: Use connectors that handle APIs, normalization, and delivery automatically. Most mid-market teams choose this because the monthly cost is less than a few hours of engineering time.
2. Cross-Channel Attribution Modeling
Once you have unified data, you need a methodology for distributing credit across touchpoints.
Rule-based attribution models:
Linear: Every touchpoint gets equal credit. Five channels equals 20% each.
Time decay: Recent touchpoints get more credit. The Facebook ad from 30 days ago gets 10%, yesterday's Google Search ad gets 50%.
Position-based (U-shaped): First and last touchpoints get 40% each, middle touchpoints split 20%.
Data-driven attribution uses machine learning to analyze actual conversion paths. Google Analytics 4 uses this as default but requires 15,000+ conversions over 90 days for reliable patterns.
The truth: No attribution model is perfect. Linear overvalues early touchpoints. Last-click undervalues everything except the final interaction. Data-driven models are black boxes.
Best practice: Use multiple models for different purposes. Linear for understanding overall channel participation. Time decay for performance marketing budget allocation. Compare both to platform-reported conversions to identify discrepancies.
3. Actionable Insights from Channel Interactions
Raw attribution data means nothing without analysis. Answer specific questions:
Which channel combinations drive the highest conversion rates? You might discover people who see both a TikTok ad and a Google Search ad convert at 4.3%, while those who only see one convert at 1.8%.
What's the optimal number of touchpoints? Analysis might show customers with 4 to 6 touchpoints convert at the highest rate, while 7+ creates decision paralysis.
Where do customers drop out? If 40% of people who click a Facebook ad never reach your website, you have a landing page speed problem, not a Facebook targeting problem.
Which channels assist vs. close? LinkedIn might generate few last-click conversions but assist on 60% of enterprise deals. Cutting LinkedIn based on last-click attribution would kill your pipeline.
5 Strategic Use Cases Beyond Basic Attribution
Use Case 1: Discovering Channel Synergy Effects
Some channel combinations perform exponentially better together than separately.
A B2B SaaS company discovered that prospects who saw their LinkedIn ad and later clicked a Google Search ad converted at 5.2x the rate of those who experienced only one touchpoint.
They tested this by pausing LinkedIn campaigns for two weeks while keeping Google Search active. Google Search conversion rates dropped 38% during the pause, even though traffic stayed constant.
The insight: LinkedIn wasn't generating direct conversions, it was making search traffic far more valuable. They reallocated 15% of Google Search budget to LinkedIn, accepting higher cost-per-click because the combined effect improved overall CAC by 22%.
How to identify synergies:
- Export conversion path data showing all touchpoints before conversion
- Calculate conversion rates for each channel combination
- Compare combined rates to single-channel rates
- Test by deliberately creating multi-touch campaigns
Use Case 2: Optimizing Customer Journey Touchpoints
Not all touchpoints add value. Some hurt conversion rates.
An e-commerce brand found that customers who received more than 3 retargeting impressions in 7 days converted at 40% lower rates than those who saw 1 to 2 impressions. They were overwhelming high-intent customers with excessive ads.
The fix: Frequency capping at 2 impressions per week across all retargeting platforms combined, not per platform. Conversion rates increased 31% while reducing retargeting spend by 18%.
Use Case 3: Cross-Channel Budget Allocation
Traditional budget allocation looks at each channel's ROAS independently. Cross channel analytics reveals total contribution.
Example:
Last-click says Google wins. Cross channel reveals Facebook and LinkedIn assist on far more conversions than they close.
The optimization: Increase LinkedIn budget by 35% even though it has the "worst" last-click ROAS. Those LinkedIn impressions make Google Search and email far more effective. Combined effect improves overall ROAS by 18%.
Use Case 4: Audience Segmentation Based on Cross-Channel Behavior
Create segments based on which channel combinations they respond to.
"High-Intent Researchers"
- Visited from organic search
- Read 3+ blog posts
- Clicked Google Search ad within 7 days
- Did not click social ads
Strategy: Skip social awareness campaigns. Focus on search and content.
"Social-First Discoverers"
- First interaction was social media
- Engaged with 2+ social posts before website visit
- Converted after social retargeting
- Never used search
Strategy: Heavy social presence with multiple creatives. Don't waste search budget.
Use Case 5: Predictive Analytics for Channel Mix
A marketing team with 12 months of cross channel data built predictions:
When LinkedIn spend increases by 20%:
- Google Search conversion rate improves by 12% (2-week lag)
- Email open rates improve by 8% (1-week lag)
- Overall CAC decreases by 7%
When TikTok spend increases by 20%:
- Google Search branded queries increase by 28% (immediate)
- Facebook retargeting costs decrease by 15% (warmer audiences)
- Conversion rate stays flat but top-of-funnel traffic increases 40%
The decision: Increase TikTok for growth periods. Increase LinkedIn for efficiency periods when CAC matters more than volume.
Overcoming the 5 Biggest Cross Channel Analytics Challenges
Challenge 1: Data Fragmentation (The Walled Garden Problem)
The problem: Facebook, TikTok, Amazon, and LinkedIn won't share user-level data. You can't see that the same person clicked your TikTok ad Tuesday and your Google Search ad Thursday.
The workaround:
Campaign-level aggregation: Analyze patterns instead of individual users. If you see a 35% spike in Google Search conversions every time you run TikTok campaigns, that's a channel synergy, even without user-level tracking.
Probabilistic matching: Use statistical models to estimate cross-channel behavior. If 40% of your TikTok audience matches your Google converter demographics, and you see correlated spikes, infer cross-channel influence with 70 to 80% confidence.
First-party data: When customers convert, ask how they heard about you. Simple survey data combined with analytics creates human-verified attribution.
Challenge 2: Attribution Model Selection
The problem: No universally "correct" attribution model exists.
The solution: Stop looking for one perfect model. Use different models for different purposes.
For budget allocation: Time decay or position-based models that balance early and late touchpoints.
For channel evaluation: Compare multiple models side-by-side. If a channel looks strong in linear but weak in last-click, it's an awareness driver, not a closer.
For executive reporting: Show platform-reported conversions alongside your attribution results. Don't hide platform numbers, add context.
For testing: Use last-click within each channel for tactical decisions, cross-channel attribution for strategic decisions.
Challenge 3: Cross-Device Tracking
The problem: Same person browses on mobile at lunch, researches on desktop at work, purchases on tablet at home. They appear as three different users.
Industry data: 60% of conversions involve multiple devices according to Google's multi-device research.
Solutions:
User ID tracking: If customers log in, pass that User ID to your analytics platform. When the same user logs in on mobile and desktop, their activity connects.
Google's cross-device reporting: GA4 uses Google account signals to connect devices when people are signed into Chrome or Google.
Accept limitations: Even with perfect implementation, 15 to 30% of cross-device behavior stays untracked. Build strategy knowing this gap exists rather than chasing 100% accuracy.
Challenge 4: Data Quality and Consistency
The problem: Each platform defines metrics differently. Google Ads uses 30-day click lookback. Facebook uses 7-day click, 1-day view. LinkedIn uses 30-day but counts conversions differently.
Result: Platforms combined claim 950 conversions when you actually had 650 customers, 46% more than reality.
The solution:
Standardize lookback windows: Choose one attribution window (like 30-day click, 1-day view) and apply it consistently. Pull raw conversion events and reattribute with consistent rules.
Define metrics once: Create a data dictionary defining "conversion," "qualified lead," "cost per acquisition" identically across platforms.
Automate normalization: Manually standardizing 6 to 8 platforms weekly isn't sustainable. Tools that handle API connections typically include data transformation, automatically converting Facebook's "purchases" to match Google's "transactions."
For more on why platform numbers don't match, see our guide on data discrepancies between Google Ads and GA4.
Challenge 5: Technical Implementation Complexity
The problem: Building cross channel analytics from scratch requires API integrations to 50+ platforms, data transformation scripts, database storage, visualization layer, and ongoing maintenance as platforms change APIs.
Most marketing teams estimate 2 to 4 months to build basic infrastructure, by which time APIs have changed and you've spent significant engineering time.
Practical solutions by budget:
Under $500/month:
- Google Analytics 4 for digital cross-channel reporting
- Google Sheets with manual exports (time-consuming but free)
- Focus on 3 to 4 core platforms
$500 to 2,000/month:
- Automated data connectors to eliminate manual exports
- Basic visualization tools
- Typical setup: 2 to 3 days instead of 2 to 3 months
$2,000+/month:
- Add data warehouse for historical storage
- Custom dashboards and sophisticated modeling
Most teams in the $500 to 2,000 range get 90% of the value with 10% of the complexity.
How to Implement Cross Channel Analytics: Step-by-Step
Step 1: Define Your Measurement Framework (Week 1)
Before connecting data, decide what you're measuring.
Answer these questions:
- What business questions do we need to answer?
- Which channels drive the most revenue? (not just last-click)
- How do channels influence each other?
- What's our true cost per acquisition?
- What does success look like?
- Allocating budget based on total contribution
- Understanding customer journey patterns
- Identifying channel synergies we're missing
- Which touchpoints matter most?
- Map typical customer journey from awareness to purchase
- Identify where customers enter
- Note where they drop off
Example framework:
B2B SaaS selling to marketing teams:
- Journey: LinkedIn/Google Search, Website, 2 to 3 blog posts, Email signup, Nurture emails, Demo request, Sales, Close
- Touchpoints to track: LinkedIn Ads, Google Search, organic search, blog content, email, demos
- Success metric: Total contribution of each channel to closed deals, not just demo requests
Step 2: Set Up Unified Data Collection (Week 2 to 3)
Connect all data sources to a central location.
Platforms to connect:
Advertising: Google Ads, Facebook/Instagram, LinkedIn, TikTok, any other paid channels
Analytics: Google Analytics 4, website tracking, form submissions, landing pages
Email and automation: Mailchimp, HubSpot, Klaviyo, marketing workflows
Revenue and CRM: HubSpot, Salesforce, Pipedrive, Shopify, WooCommerce, payment processors
Choose your destination:
Google Sheets: Best for teams under 100,000 rows monthly. Easy to share, familiar interface.
Looker Studio: Free visualization from Google. Best if you're heavily using Google Analytics and Google Ads.
Power BI or Tableau: More sophisticated visualization. Worth the cost for advanced dashboards.
BigQuery or Snowflake: Data warehouse. Choose if you need years of historical data or have engineering resources.
Implementation: You can manually pull data from each platform's API and write transformation scripts, which takes weeks to build. Or use tools designed for this that connect to 50+ platforms automatically. If you're pulling from multiple advertising and analytics platforms regularly, tools like Dataslayer handle connections, transformations, and scheduling. Setup takes days instead of months.
Step 3: Choose Your Attribution Methodology (Week 3)
Pick models based on what you're optimizing.
Most teams should implement two models:
Platform-reported (last-click): For tactical optimization within each platform. "Which Facebook ad creative performs best?"
Linear or position-based: For strategic budget allocation. "Should we increase LinkedIn spend even though last-click ROAS looks bad?"
Don't get paralyzed. Start with linear attribution. Run it for 30 days. Compare to platform numbers. If discrepancies reveal insights, you picked a good model.
Step 4: Build Your Cross-Channel Dashboard (Week 4)
Create visualizations that answer your business questions.
Essential metrics:
Channel Performance:
- Total conversions by channel (last-click)
- Assisted conversions by channel
- Total contribution (last-click + assisted)
- Cost per acquisition (last-click vs. total contribution)
- ROAS by channel
Channel Interactions:
- Most common channel combinations
- Conversion rate by number of touchpoints
- Average time between touchpoints
- Path length before conversion
Customer Journey:
- Sankey diagram showing traffic flow between channels
- Conversion path table showing sequences
- Drop-off points
Budget Analysis:
- Current budget split vs. total contribution split
- Recommended budget adjustments
- Projected impact of shifts
For building dashboards that people actually use, see our guide on marketing dashboard best practices.
Step 5: Analyze and Optimize (Ongoing)
Monthly analysis checklist:
Week 1: Identify which channels show big differences between last-click and total contribution
Week 2: Test hypotheses based on attribution data
Week 3: Analyze which combinations convert best
Week 4: Adjust budgets based on total contribution. Shift 10 to 15% at a time, measure impact
Signals you need to redistribute budget:
- Channel has high assists but low budget (increase)
- Channel has low assists and low last-click (decrease)
- Channel combination shows 2x+ conversion rate (create campaigns combining those channels)
- Increasing Channel A consistently improves Channel B (increase Channel A)
Cross Channel Analytics Tools and Technology Stack
Data Collection & Integration Layer
This connects to each platform's API, extracts data, normalizes formats, and delivers clean data.
What to look for:
- Connects to platforms you use
- Handles authentication and API changes automatically
- Normalizes data (dates, metrics, naming)
- Scheduled automated refreshes
- Delivers to your preferred destination
Budget consideration: Most connector platforms charge $69 to 300/month. Compare to hundreds of hours of engineering time for equivalent functionality.
When to build custom vs. use tools:
Build custom if: You have data engineering resources, need highly specialized transformations, or have 5+ years of historical data.
Use tools if: You're a marketing team without engineers, need results in days not months, or want to avoid maintenance.
If you're pulling from multiple advertising and analytics platforms, Dataslayer connects 50+ sources and handles normalization automatically. Setup takes 2 to 3 days instead of months.
Analysis & Visualization Layer
Google Looker Studio
- Best for: Google-centric teams, free dashboards
- Cost: Free
Microsoft Power BI
- Best for: Microsoft ecosystem, advanced analytics
- Cost: $10/user/month (Pro)
Tableau
- Best for: Enterprise teams, custom visualizations
- Cost: $70+/user/month
Google Sheets
- Best for: Small teams, simple reporting
- Cost: Free
Most teams start with Looker Studio or Sheets, then graduate to Power BI or Tableau if they need more sophisticated analytics.
Attribution & Measurement Platforms
Google Analytics 4
- Built-in cross-channel reporting for digital touchpoints
- Data-driven attribution included
- Free for most businesses
Customer Data Platforms (CDPs)
- Examples: Segment, mParticle
- Unified customer profiles
- Cost: $10,000 to 100,000+ annually
Marketing Mix Modeling
- Statistical analysis of aggregate channel performance
- Cost: $50,000 to 500,000+ per analysis
Most mid-market teams get sufficient attribution from GA4 for digital attribution, connector tools to pull platform data, custom dashboards in Looker Studio or Power BI, and manual analysis of channel interactions.
7 Best Practices for Success
1. Start with Business Questions, Not Tools
Don't ask "What tool should we use?" Ask "What decisions do we need to make?"
If your question is "Should we increase Facebook or Google budget?", you need channel-level attribution and budget allocation analysis, not enterprise journey mapping.
Match tools to questions.
2. Implement Consistent Naming Conventions
Inconsistent naming breaks cross-channel analysis.
Bad:
- Google: "spring_sale_2026"
- Facebook: "Spring Sale 2026 - Awareness"
- LinkedIn: "SpringSale-2026-Promo"
Good (consistent structure):
{channel}_{campaign}_{type}_{date}

google_springsale_search_20260301
facebook_springsale_awareness_20260301
linkedin_springsale_awareness_20260301
Apply this to campaigns, ad groups, UTM parameters, and conversion goals.
3. Use UTM Parameters Religiously
UTM parameters are the foundation of cross-channel tracking in GA4.
Required for every link:
?utm_source=facebook
&utm_medium=paid_social
&utm_campaign=spring_sale_2026
&utm_content=carousel_ad_v2
Common mistakes:
- Forgetting UTMs on email links (shows as "direct")
- Using different source names ("facebook" vs "Facebook")
- Missing UTMs on social bio links
Check GA4 traffic sources. Large amounts of "direct" traffic means missing UTM parameters.
4. Don't Trust a Single Attribution Model
Every model has biases. Last-click overvalues closing channels. First-click overvalues awareness. Linear treats all touchpoints equally.
Run multiple models in parallel. If a channel looks strong in every model, it's genuinely performing. If it looks good in linear but terrible in last-click, it's an awareness driver.
5. Combine Quantitative Data with Qualitative Insights
Attribution data tells you what happened. Human insight explains why.
Add qualitative research:
- Post-purchase surveys: "How did you first hear about us?"
- Sales feedback on which channels prospects mention
- Customer interviews about research process
Real example: Attribution showed LinkedIn had low last-click but high assists. Qualitative research revealed prospects saw LinkedIn ads, remembered the company, then Googled the brand weeks later when they had budget.
Insight: LinkedIn created brand awareness showing up as "branded Google Search" conversions. Instead of cutting LinkedIn, they increased it because those search conversions only existed because of LinkedIn.
6. Review and Adjust Monthly, Not Quarterly
Customer behavior changes fast. Quarterly reviews miss important shifts.
Monthly rhythm:
- Week 1: Review attribution data, identify anomalies
- Week 2: Analyze channel interactions
- Week 3: Test hypotheses
- Week 4: Measure results, prepare next month's recommendations
If you only review quarterly, you'll miss a 3-month trend before reacting.
7. Document Your Methodology for Stakeholders
Cross-channel attribution confuses people who don't work with it daily.
Create a one-page explainer:
"How We Measure Marketing Performance"
- Platform numbers: We track these for campaign optimization. They use last-click and count conversions multiple times.
- Cross-channel attribution: We connect platforms to see the full journey. Shows total contribution, not just last-click.
- Why numbers differ: Platforms count the same conversion multiple times. Our attribution distributes credit across all touchpoints.
- How we use both: Platform numbers optimize individual campaigns. Cross-channel guides budget allocation.
Share with executives and finance. Prevents "Why doesn't this match Google Ads?" questions every month.
The Future: Privacy-First Measurement
The End of Third-Party Cookies
Chrome's cookie deprecation means you can't track users across websites unless they're logged in.
What this breaks:
- Cross-site retargeting
- Attribution across websites
- Third-party data enrichment
What still works:
- First-party data (information users give you)
- Platform-native tracking (Google within Google, Facebook within Facebook)
- Aggregate analytics
- Server-side tracking
Strategy shift: Focus on collecting first-party data through email signups and account creation. Build audiences from actual customer data.
Server-Side Tracking Becomes Standard
Browser-based tracking is increasingly blocked. Server-side tracking sends data directly from your web server to analytics platforms, bypassing browser restrictions.
Benefits:
- More accurate (not blocked)
- Faster page loads
- Better data control
- Complies with privacy regulations
GA4, Facebook, and major platforms now support server-side implementation.
Consent-Based Measurement
GDPR, CCPA, and similar regulations require explicit consent for tracking.
Impact: 30 to 50% of users opt out in regions with strict privacy laws.
Techniques:
Aggregated reporting: Focus on trends rather than individual tracking. You don't need to track every individual to know "TikTok campaigns increase Google Search traffic by 40%."
Cohort analysis: Group users by behavior without individual tracking.
Modeled conversions: Platforms use machine learning to estimate conversions for opted-out users based on patterns from opted-in users.
AI and Machine Learning in Attribution
Google Analytics 4's data-driven attribution uses machine learning to analyze paths and weight touchpoints based on true influence, not predetermined rules.
Limitation: Requires 15,000+ conversions over 90 days. Small businesses can't meet this threshold.
Where AI helps most:
- Pattern recognition for channel combinations
- Anomaly detection when attribution patterns change
- Predictive modeling for budget impact
- Automated optimization
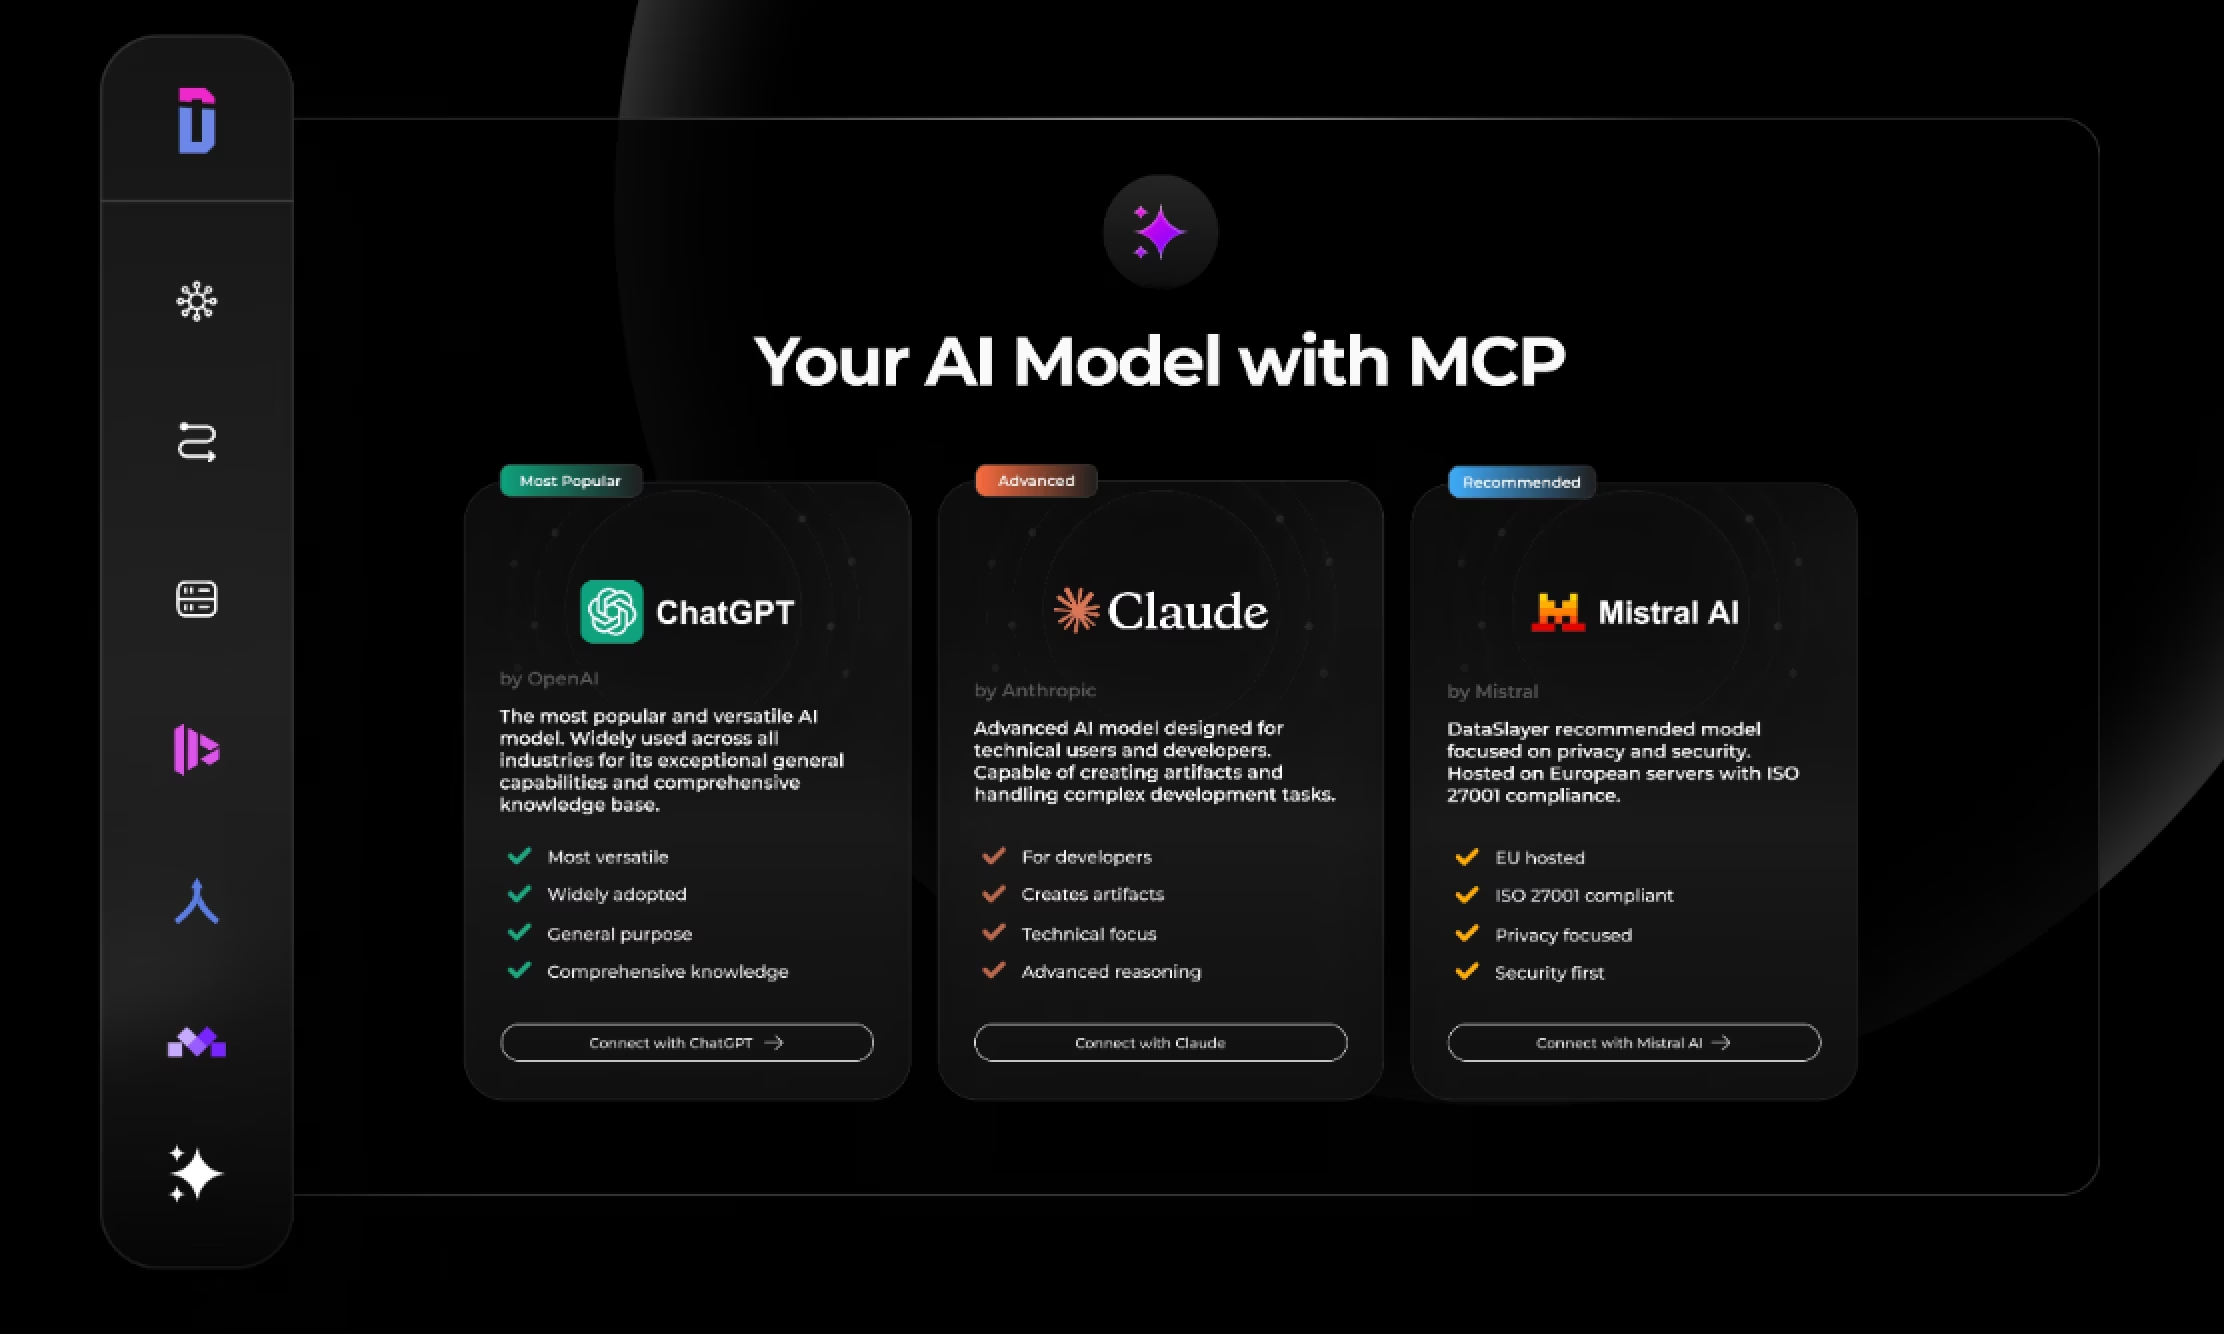
Dataslayer's MCP integration lets you ask questions conversationally: "Which channel combination had the highest conversion rate last month?" The AI interprets your question and returns actual data.
This is the future: conversational interfaces to marketing data instead of building dashboards manually.
Get Started with Cross Channel Analytics Today
Cross-channel analytics transforms how you understand marketing performance. Instead of treating each platform as isolated, you see the full customer journey and make budget decisions based on total contribution.
Core benefits:
- Stop wasting budget on channels that appear ineffective but actually drive conversions
- Discover channel synergies where combinations outperform individual channels
- Allocate budget based on total contribution, not incomplete last-click data
- Understand actual customer journeys across touchpoints
Next steps:
- Define your measurement framework. What questions do you need to answer?
- Connect your data sources. Pull advertising, analytics, and revenue data into one place
- Choose attribution models. Run both last-click (tactical) and linear (strategic)
- Build analysis dashboards. Visualize channel performance and interactions
- Optimize based on insights. Shift budgets toward high-contribution channels
You don't need enterprise platforms or data engineering teams. Most mid-market teams get 90% of the value using GA4, automated data connectors, and basic visualization tools.
Want to skip manual data pulling from multiple platforms? Try Dataslayer free for 15 days to automatically connect Google Ads, Facebook, LinkedIn, TikTok, GA4, and 50+ platforms to Google Sheets, Looker Studio, BigQuery, or Power BI. Setup takes hours instead of months. Start 15-day free trial.
Frequently Asked Questions
What's the difference between multi-channel and cross-channel analytics?
Multi-channel analytics measures individual channels separately. Cross-channel analytics tracks how channels influence each other throughout the customer journey. You discover that 67% of Google Ads conversions also saw a Facebook ad, revealing Facebook assists far more than last-click shows.
How much data do I need before attribution models are reliable?
For rule-based models (linear, time decay): 50 to 100 conversions per month minimum.
For data-driven attribution: 15,000+ conversions over 90 days. The algorithm needs large datasets for statistically significant patterns.
Start with rule-based models. Switch to data-driven once you meet the threshold.
Do I need a data warehouse for cross-channel analytics?
No. Most teams under 500,000 rows per month use Google Sheets or basic BI tools effectively.
You benefit from a warehouse (BigQuery, Snowflake) if you need years of historical data, complex SQL queries, or integration with other business systems.
Start simple. Graduate to a warehouse only when you outgrow basic tools.
How do I handle offline conversions in cross-channel attribution?
Phone calls: Use call tracking with dynamic numbers connecting to digital campaigns.
In-store purchases: Connect via loyalty programs, email receipts, or unique promo codes tied to campaigns.
Mail or forms: Use campaign-specific promo codes or landing pages tracking back to source channels.
Create a unique identifier connecting the offline conversion to the digital touchpoint that drove it.
Should I trust platform-reported conversions or my attribution model?
Both, for different purposes.
Platform-reported (last-click): For tactical campaign optimization within each platform. Which ad creative performs better?
Your attribution model: For strategic budget allocation. Should we increase LinkedIn spend even though last-click ROAS looks low?
Neither is "wrong." They answer different questions.
How often should I update my attribution model?
Review methodology every 6 months or when you make major marketing changes:
- Launching new channels
- Changing customer journey significantly
- Major budget increases/decreases
- New conversion goals
Your model should reflect current business reality.
Can I do cross-channel analytics with a small budget?
Yes. You don't need enterprise platforms.
Free options:
- Google Analytics 4 for digital cross-channel reporting
- Google Sheets with manual exports
- Looker Studio for visualization
Under $500/month:
- Automated data connectors
- Basic visualization tools
- Focus on 3 to 4 core channels
Cross-channel analytics is about methodology more than tools. Even with basic tools, you can track channel interactions and make better budget decisions.


