
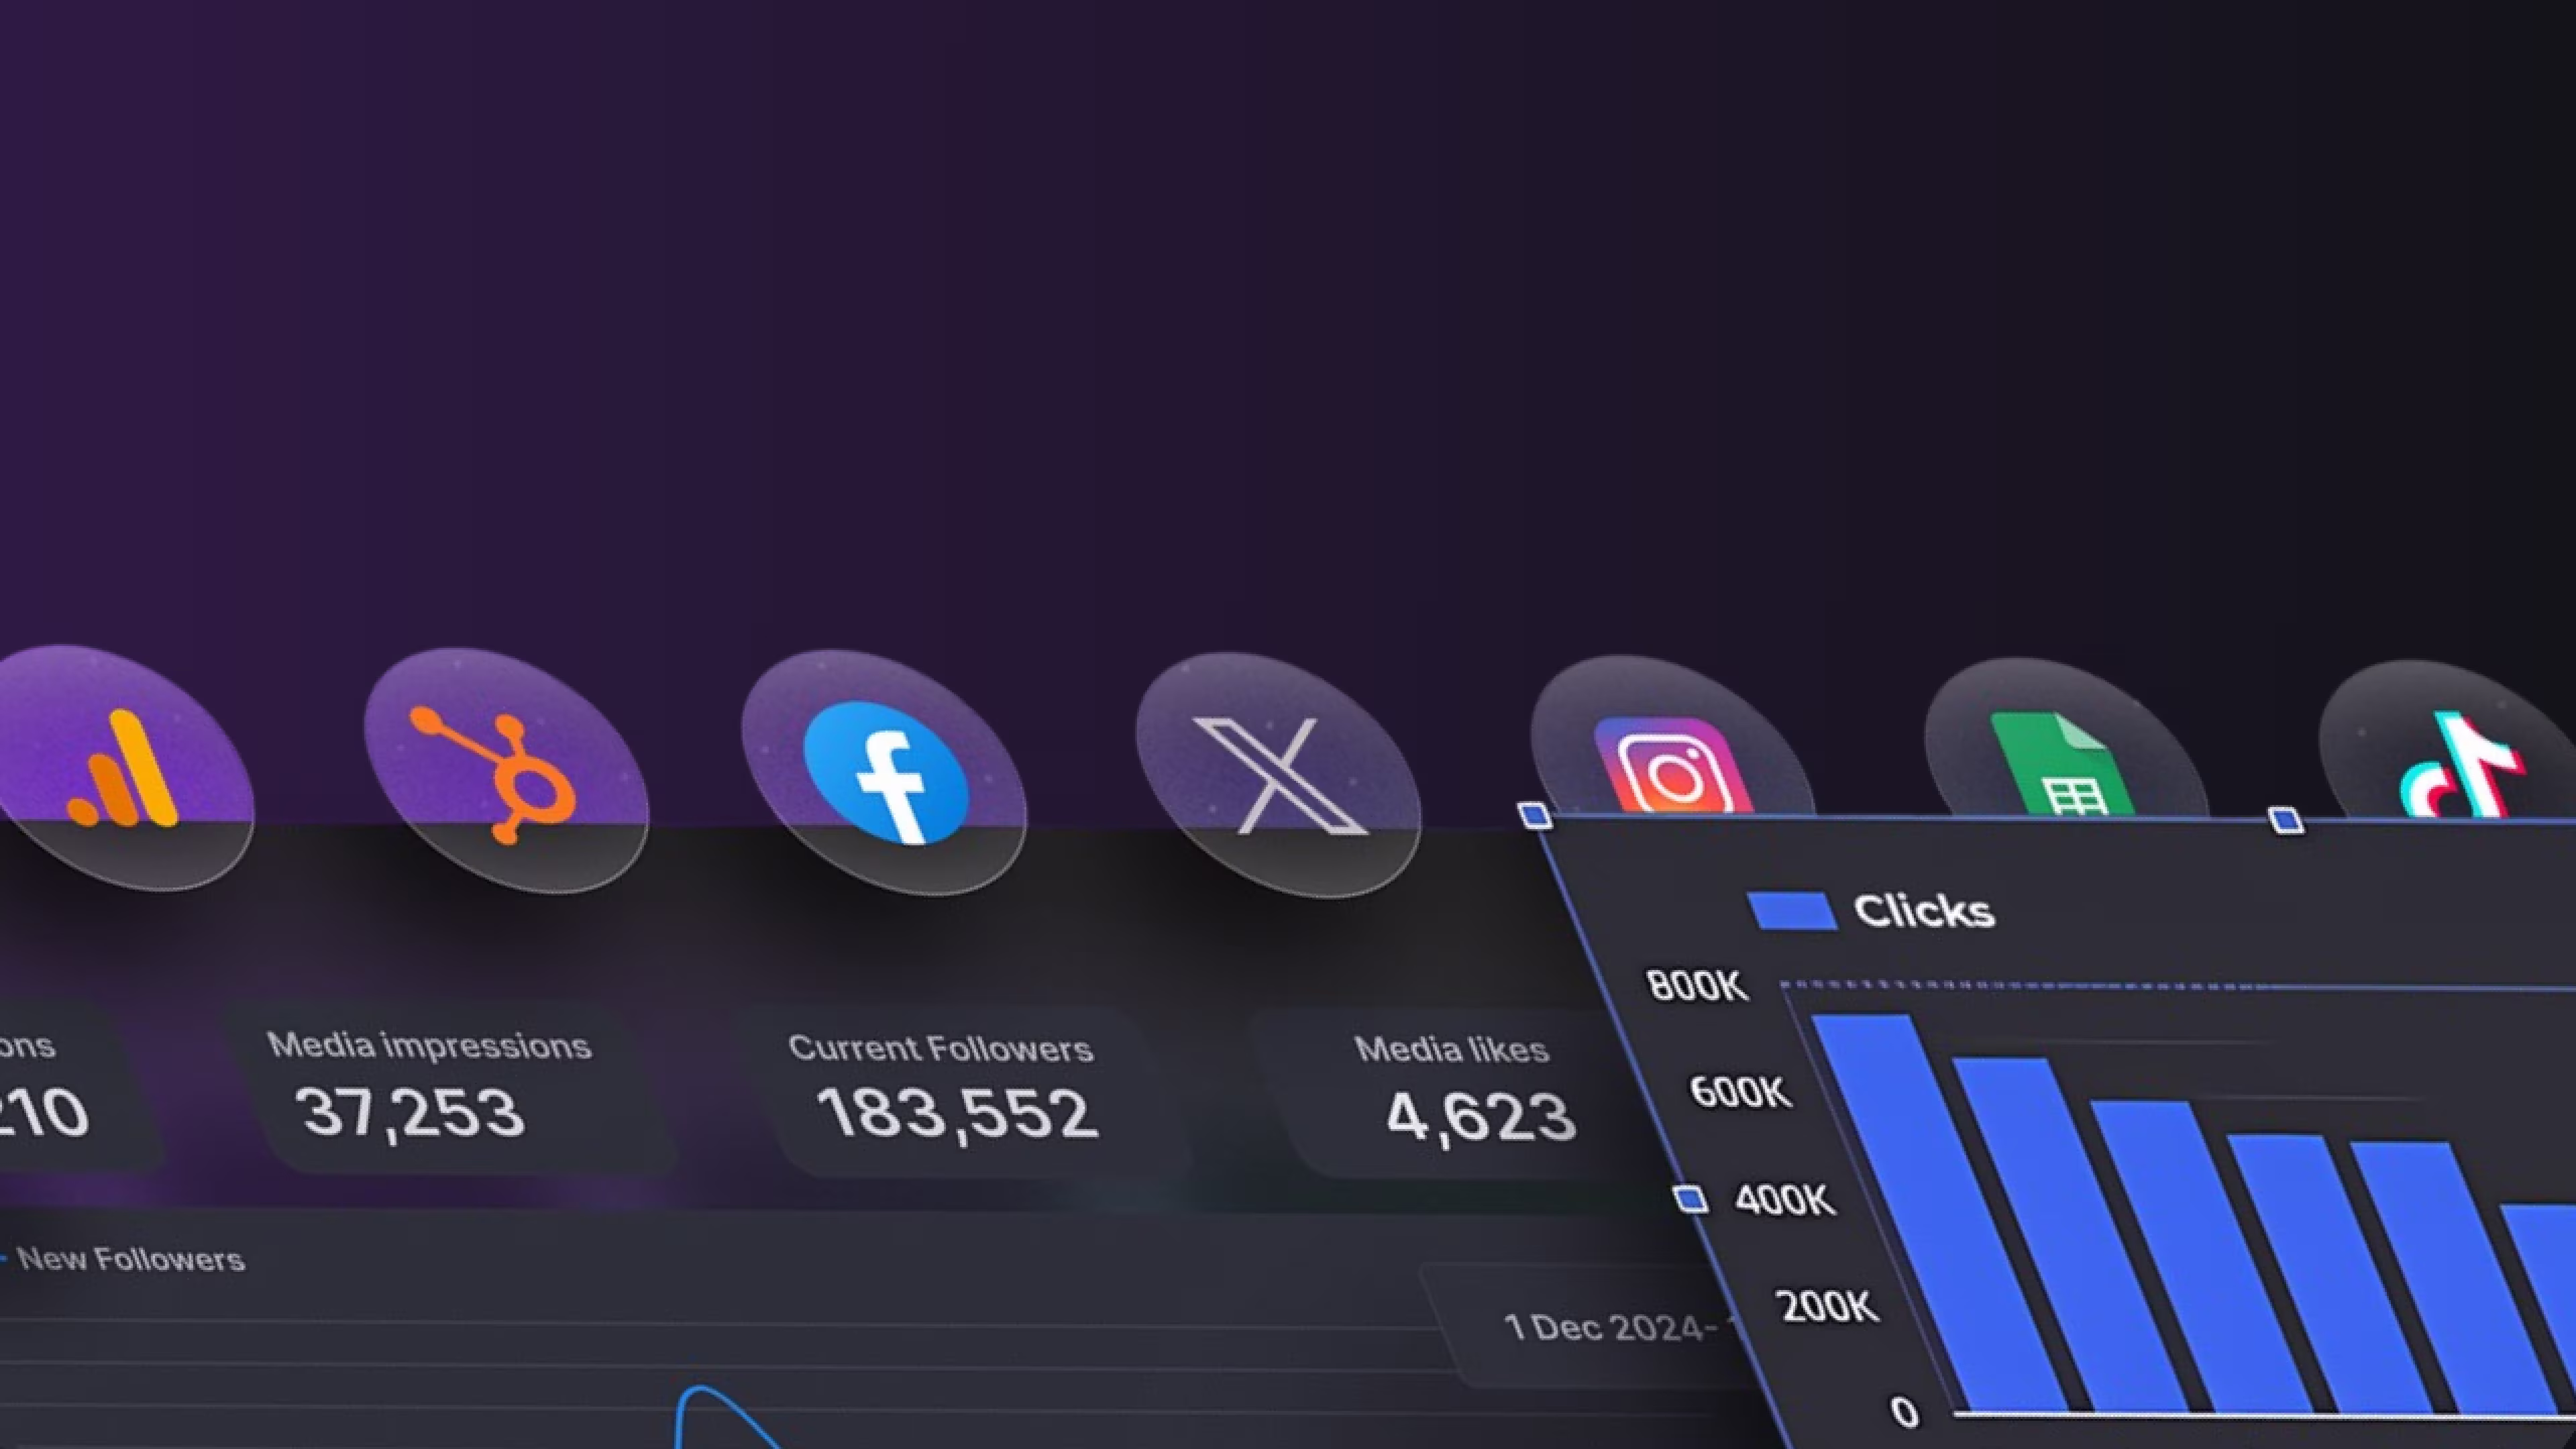
TikTok Ads Manager shows you 8 million impressions and a 2.1% CTR. Meta reports $15k spend with 450 conversions. Google Ads claims $8k cost with 3.2 ROAS. But here's the question no single platform can answer: Which combination of channels actually drives your revenue?
Recent research from Impact.com shows that consumers typically engage with brands 3+ times across digital channels before purchase, with high-earning consumers requiring 5+ touchpoints. Meanwhile, research from MMA Global shows that over half of marketers (52%) now use multi-touch attribution, with 57% calling it "crucial" for measurement. Yet most marketers still analyze each channel in isolation, missing the attribution patterns that reveal true performance.
This guide shows 5 specific analyses impossible to build in native dashboards, analyses that answer the questions keeping CMOs awake at night.
The Problem With Platform-Specific Analytics
Every ad platform optimizes for its own success metrics. TikTok celebrates video completion rates. Meta highlights link clicks. Google touts conversion value. Each dashboard tells you you're winning, until you check your bank account.
Here's what happens when you rely on native analytics:
- Duplicate attribution – A customer sees your TikTok ad, searches on Google, and converts through a Facebook retargeting ad. All three platforms claim the conversion. Your actual ROAS? Unknown.
- Fragmented budget decisions – TikTok CPM is $8, Meta is $12, LinkedIn is $22. Which is actually cheaper? You can't tell without normalizing for audience quality and downstream conversion rates.
- Blind spot optimization – You pause underperforming TikTok campaigns, then watch Meta's CPA spike 40%. Turns out TikTok was your top-of-funnel engine. Oops.
Google Analytics recently added native cost imports from Meta and TikTok in October 2025, signaling that even major platforms recognize the need for unified reporting. But auto-imports only solve half the problem, they give you cost data, not answers.
5 Analyses You Can Only Build With Cross-Platform Data
1. True Multi-Touch Attribution Analysis
The Question: Which platform actually starts your customer journey vs. which one gets credit?
TikTok Ads Manager will show you "500 conversions attributed to TikTok." But it can't show you that 320 of those users first discovered your brand on TikTok three weeks ago, searched for you on Google last week, and finally converted after seeing a Meta retargeting ad yesterday.
What You Need:
- User-level journey data across all platforms
- Timestamp sequences showing actual touchpoint order
- Custom attribution models (first-touch, last-touch, linear, time-decay)
Industry Pattern: DTC brands commonly discover that 50-70% of their "last-click conversions" on one platform started with awareness campaigns on another. When budget ratios shift to reflect the full funnel, blended CPA often drops 15-30% while conversion volume increases.
How to Build It: Connect UTM parameters consistently across all platforms, consolidate click and conversion data into a single source using tools like automated cross-platform connectors, then map user journeys chronologically. Most marketers skip this because pulling data from 3+ APIs manually takes 6+ hours weekly.
2. Platform Efficiency Benchmarking (Apples to Apples)
The Question: Is your $8 TikTok CPM actually cheaper than your $12 Meta CPM?
Surface-level cost metrics lie. What matters is cost per qualified action adjusted for audience intent and conversion probability.
What You Need:
- Normalized metrics across platforms (same date range, same audience objective)
- Downstream conversion rates by traffic source
- Revenue per user by platform (not just conversion count)
Industry Benchmark Example: Common patterns show:
- TikTok often has the lowest CPM but mid-range conversion rates
- Meta balances cost and conversion efficiency
- Google typically has higher costs but significantly higher ROAS due to high-intent searches

The Insight: TikTok drives awareness (lower CPA, lower AOV). Google captures high-intent searches (higher costs, much higher ROAS). Both are valuable, but for different funnel stages. Without cross-platform visibility, you'll over-allocate budget based on misleading cost metrics.
3. Cohort Analysis Across Channel Combinations
The Question: Do customers who see TikTok + Meta ads convert faster/more often than single-platform exposure?
You're running TikTok for awareness, Meta for consideration, and Google for conversion. But you don't know if multi-platform exposure actually increases purchase probability, or if you're just wasting money on redundant impressions.
What You Need:
- User-level exposure data across platforms
- Cohort segmentation by channel combination
- Time-to-conversion and LTV metrics per cohort
Industry Research Pattern: Studies on multi-touch attribution consistently show that users exposed to multiple marketing channels convert at 2-4x higher rates than single-channel exposure. The exact multiplier varies by industry and average order value.
The Discovery: Users who see your brand on 2+ platforms typically convert at significantly higher rates and have 30-50% lower CAC. This insight allows you to restructure strategy to intentionally create multi-platform sequences rather than treating each channel independently.
4. Cross-Platform Budget Allocation Optimization
The Question: If I shift $1,000 from TikTok to Meta (or vice versa), what happens to my total conversions?
Budget allocation becomes guesswork when you can't model the interdependencies between channels. Cutting TikTok might kill your Meta retargeting pool. Boosting Google might not work if your awareness engine (TikTok/Meta) isn't feeding it.
What You Need:
- Historical performance data across all channels
- Conversion flow analysis (which platforms feed which)
- Marginal ROI calculations per channel at different spend levels
Strategic Approach: Build scenario models comparing different budget allocations. Key insight: most channels have diminishing returns curves. Your first $5k on TikTok might return 4x ROAS, but your next $5k returns only 2.5x. Meanwhile, your first $3k on Meta returns 5x. Optimal allocation requires understanding these curves across all platforms simultaneously.
Common Finding: The "optimal" split is rarely 100% on your best-performing channel. Platform interdependencies mean a 60/30/10 split often outperforms 100/0/0, even when one platform appears superior in isolation.
5. Creative Performance Intelligence Across Platforms
The Question: Does this creative concept work better on TikTok, Meta, or Google?
A video ad crushing it on TikTok (5% CTR) might flop on Meta Reels (1.2% CTR). A static image killing Meta (4.8% CTR) might be invisible on TikTok. Without cross-platform creative testing, you're either avoiding winning concepts or wasting budget on wrong placements.
What You Need:
- Creative asset performance by platform
- Normalized CTR/engagement metrics
- Cost efficiency per creative type per platform
Industry Pattern: Common observations include:
- UGC testimonials typically perform 40-80% better on TikTok than other platforms
- Product demos often achieve highest CTRs on Google Display and YouTube
- Trend-based content works almost exclusively on TikTok
- Before/after transformations consistently outperform on Meta/Instagram
Advanced Layer: Track how creative performance on one platform predicts performance on others. If a TikTok video hits >4% CTR, it's often worth testing on Meta Reels. This lets you pre-qualify winners before spending big on adaptation.
How to Actually Build These Analyses
You have three options:
- Option 1: Manual Exports (The Painful Way)
Export CSVs from TikTok Ads Manager, Meta Ads Manager, and Google Ads. Merge in Excel using VLOOKUP. Update weekly. Cry when date formats don't match and currencies need conversion. Time investment: 8-12 hours/week.
- Option 2: Custom API Integration (The Developer Way)
Hire a data engineer to build connectors for TikTok Ads API, Meta Marketing API, and Google Ads API. Maintain authentication tokens. Handle rate limits and schema changes. Cost: $15k-40k initial build + $3k-8k/month maintenance.
- Option 3: Automated Data Integration (The Smart Way)
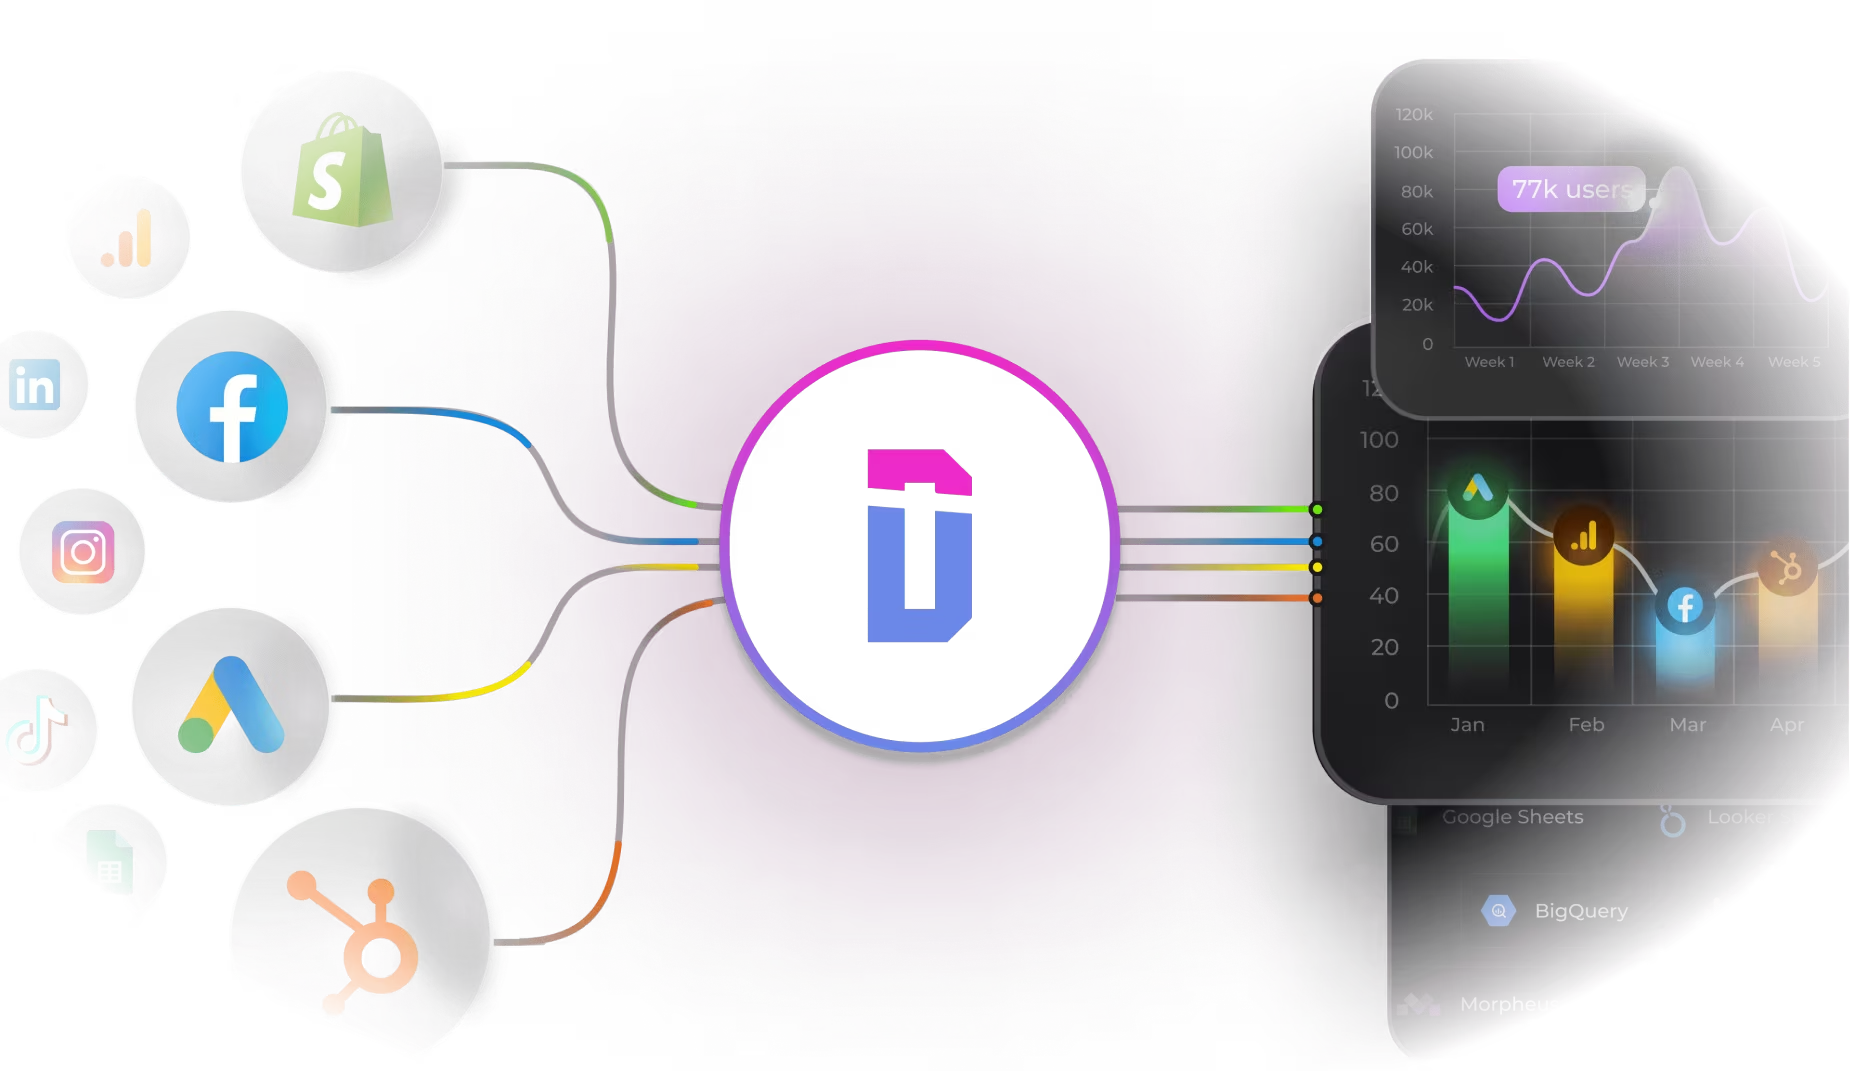
Use a platform that connects to all your ad sources and automatically syncs data to your existing tools. Connect TikTok Ads to Google Sheets, build Looker Studio dashboards, or push to BigQuery/Power BI. Configure once, get updates on autopilot. Time investment: 30 minutes setup, then 0 hours/week.
Common Cross-Platform Analytics Mistakes
Mistake 1: Comparing Incompatible Date Ranges
TikTok reports in UTC. Meta uses account timezone. Google uses campaign timezone. Your "yesterday" is actually three different days. Always normalize timestamps before comparison.
Mistake 2: Ignoring Conversion Window Differences
According to official platform documentation, TikTok defaults to 7-day click and 1-day view attribution. Meta also uses 7-day click, 1-day view as default. Google Ads uses 30-90 day windows. Your "ROAS" varies wildly depending on which window you use. Standardize attribution windows across all platforms.
Mistake 3: Treating All Conversions Equally
A TikTok "Add to Cart" ≠ a Google "Purchase" ≠ a Meta "Lead Form Submit." Weighting them equally in your analysis produces garbage insights. Assign conversion values based on downstream revenue potential.
Mistake 4: Not Accounting for Audience Overlap
Running the same campaign on TikTok, Meta, and Google? You might be paying 3x to reach the same 10,000 people. Use platform audience overlap tools or look for duplicate conversion timestamps across channels.
FAQ: Cross-Platform Ad Analytics
How do I connect TikTok Ads data with Google Analytics?
Google Analytics now supports automatic cost data imports from TikTok through native integration as of October 2025. Navigate to Admin > Data Import > Cost Data Import in GA4, select TikTok, and authenticate. This pulls 24 months of historical cost data automatically. However, this only imports cost metrics, for campaign structure, creative performance, and audience data, you'll need additional integrations.
What's the difference between cross-platform reporting and attribution?
Cross-platform reporting shows what happened on each channel. Attribution analyzes why conversions happened by mapping user journeys across channels. Reporting is "what," attribution is "how." Both require consolidated data, but attribution needs user-level journey tracking, not just aggregated metrics.
Can I track TikTok Ads performance in Looker Studio?
Yes, through data connectors that pull TikTok Ads API data into Looker Studio. Once connected, you can build custom dashboards mixing TikTok with Google Analytics, Google Ads, Meta, or other sources. Check out free Looker Studio templates to get started quickly.
How often should I analyze cross-platform data?
Most businesses: Weekly aggregated metrics reviews + monthly deep-dives into attribution and budget optimization.
High-spend accounts ($50k+/month): Daily cost/conversion monitoring, weekly creative reviews, monthly attribution analysis.
E-commerce peak seasons: Daily or twice-daily reviews.
The key is automation, set up automated data syncs and alerts so you're reviewing insights, not compiling spreadsheets.
What metrics should I standardize across platforms?
Normalize CPM, CPC, CTR, CPA, ROAS, and conversion rates across platforms. Create a master metrics dictionary, ensure consistent currency conversion, use the same timezone, and align attribution windows (e.g., all 7-day click attribution). This prevents comparing apples to oranges when TikTok reports CPM in dollars while Meta uses cents.
The Bottom Line on Cross-Platform Analytics
Your competitive advantage isn't running ads on TikTok, Meta, and Google, everyone does that. Your edge is understanding how those channels work together to create efficient customer acquisition machines.
The 5 analyses above (multi-touch attribution, efficiency benchmarking, cohort analysis, budget optimization, creative intelligence) separate marketers who "run ads" from marketers who build profitable growth engines.
Start with the analysis that matches your biggest pain point:
- Wasting budget? → Build #4 (budget allocation optimization)
- Can't prove channel value? → Build #1 (multi-touch attribution)
- Creative underperforming? → Build #5 (creative intelligence)
- Unsure where to invest more? → Build #2 (platform benchmarking)
- Want to test channel synergies? → Build #3 (cohort analysis)
Every analysis requires the same foundation: consolidated, clean, automated data from all your platforms. Once you have that, the insights practically build themselves.
Want to automate cross-platform reporting? Try Dataslayer free for 15 days to connect TikTok, Meta, Google, LinkedIn, and 50+ platforms to Google Sheets, Looker Studio, BigQuery, or Power BI. Zero code required. Start your free trial.
Note: Performance examples in this article are illustrative scenarios based on common industry patterns and aggregated benchmarks, not specific client case studies.


