
![Track Meta Ads Performance: Free vs Paid Methods Compared [2026]](https://cdn.prod.website-files.com/67f92f5125ed9f5f435861ef/698ca956e291ab3b142b059e_How%20to%20Track%20Meta%20Ads%20Performance%20Manual%20vs%20Automated%20%5B2026%20Guide%5D.avif)
Weekly Meta Ads reporting usually looks like this: download CSV from Ads Manager, import to Google Sheets, format columns, build charts, send to team. The problem appears when you need historical data, those old exports are gone or the column headers changed.
Most marketers track Meta Ads performance one of three ways: downloading CSV files manually, using Looker Studio's free Facebook connector, or paying for automation tools. Each fits different situations. Here's what they actually do.
Manual Meta Ads Performance Tracking with CSV Exports
Download spreadsheet files directly from Meta Ads Manager.
How it works:
- Log into Meta Ads Manager
- Go to Ads Reporting
- Select date range and metrics
- Download CSV
- Import to Google Sheets or Excel
- Build charts and format
Advantages:
- Zero cost. No subscriptions or tool fees.
- Complete control over which metrics appear and how data gets formatted.
- Works offline once downloaded, no internet dependency for analysis.
Limitations:
Your spreadsheet shows a frozen snapshot. Meta Ads performance data updates continuously, but your CSV only reflects the moment you exported. Need current numbers? Download again.
Managing multiple client accounts means separate exports for each one. Five clients = five separate downloads and five formatting sessions.
Historical comparisons require saving old files and hoping Meta hasn't changed the CSV column structure between exports.
One wrong formula breaks every calculation that depends on it.
When this makes sense: You manage one account, check performance weekly rather than daily, and don't need frequent historical comparisons.
Looker Studio Native Connector for Meta Ads Tracking
Google's Looker Studio includes a native Facebook Ads connector at no cost.
Setup steps:
- Create new Looker Studio report
- Add data source → Facebook Ads
- Authorize your Meta account
- Build visualizations
- Share dashboard link
Why use this:
- Auto-refresh when you open the dashboard. No manual export step.
- Historical data access without saving files. Query past months automatically.
- Shareable links instead of emailing screenshots weekly.
- Still free, included with your Google account.
Where it falls short:
The native connector typically handles one ad account at a time. Managing three clients usually means building three separate dashboards and switching between them.
Some advanced Meta metrics don't appear through the connector. Specific creative-level data, certain attribution breakdowns, or custom conversion details may be limited.
Cross-platform reporting gets complicated. Combining Meta Ads with Google Ads or TikTok in one unified view requires workarounds or separate connectors.
Large date ranges can take 30+ seconds to load, which adds up when you check performance daily.
When this makes sense: You manage one or two accounts, need standard metrics (spend, impressions, clicks, conversions), and don't compare Meta against other advertising platforms.
Automated Meta Ads Performance Tracking Tools
Third-party tools that connect Meta Ads (plus other platforms) to reporting destinations automatically.
Getting started:
- Search/install connector for Looker Studio, Google Sheets, or warehouse
- Authorize Meta Ads account(s)
- Select metrics and set refresh schedule
- Data updates automatically
- Use pre-built templates for common reporting needs or build custom dashboards
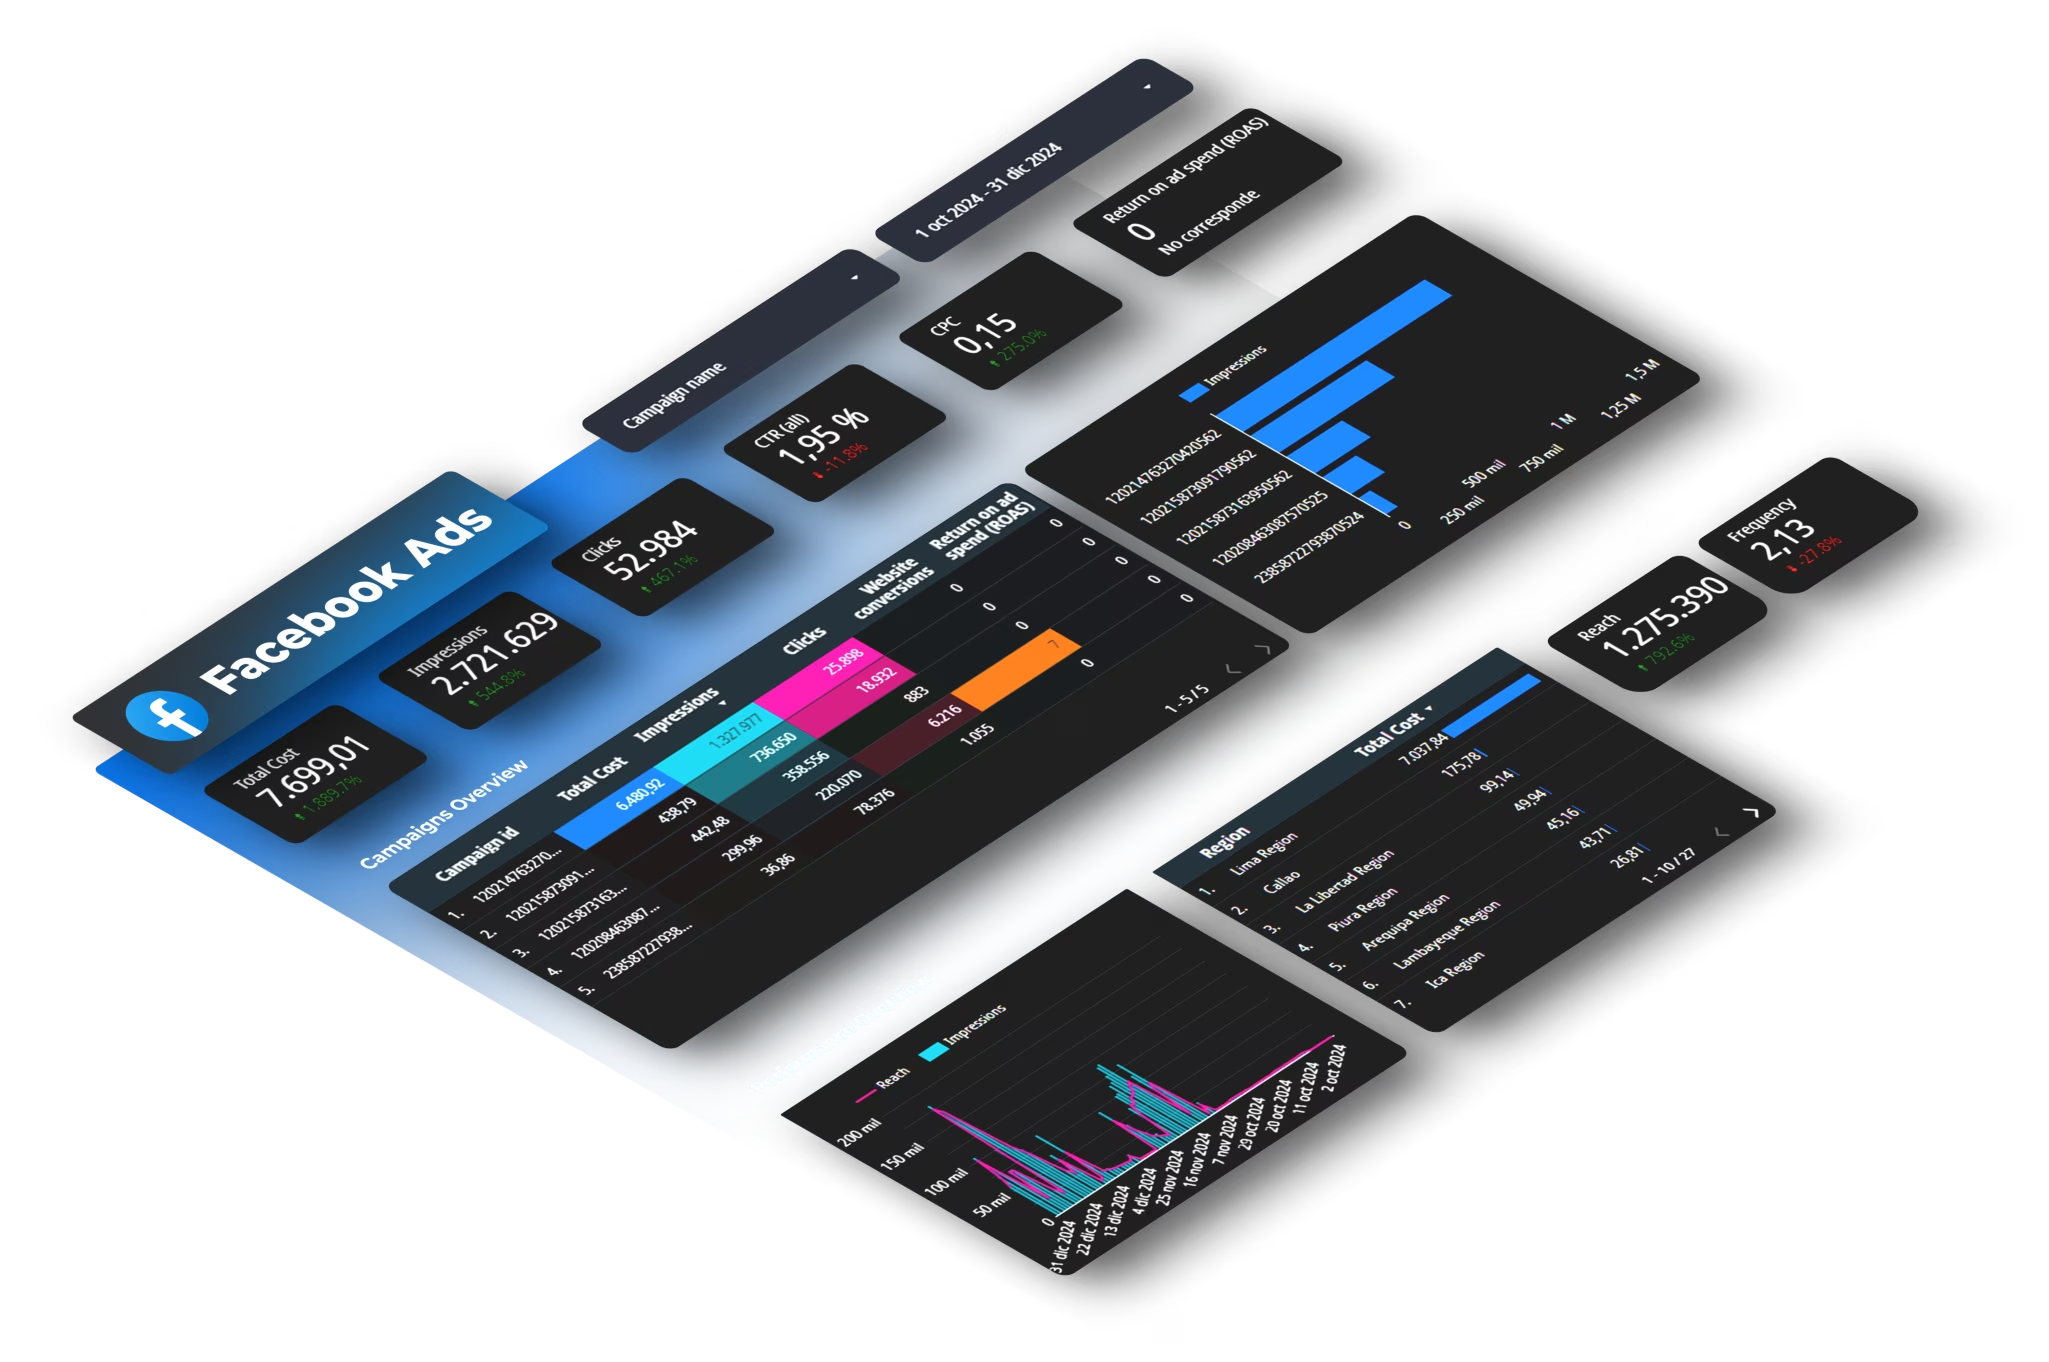
Key benefits:
- Multiple accounts in one dashboard. Connect all client accounts and compare performance side-by-side.
- Cross-platform reporting. Pull Meta Ads, Google Ads, LinkedIn, TikTok, and GA4 into the same unified view. See total ad spend across all channels at once.
- Full Meta API access, every metric including advanced breakdowns and custom conversions.
- Scheduled automatic updates. Set hourly refresh, daily at 9am, or on-demand. Zero manual work.
- Historical data persists even after campaigns end, enabling year-over-year analysis without saved files.
The trade-offs:
Paid plans available based on connectors, users, and accounts needed.
Initial setup requires understanding authentication and data sources. Not instant, but not complicated.
Service dependency. If the connector has technical issues, dashboards don't update until fixed.
When this makes sense: You manage multiple accounts, check performance daily, need cross-platform comparison, or the time saved exceeds the monthly cost.
Comparing Methods to Track Meta Ads Performance
Three Common Meta Ads Performance Tracking Mistakes
Trusting fresh conversion numbers. Meta's attribution windows mean conversion data changes for 24-48 hours as delayed attributions get counted. Tuesday's performance often looks different by Thursday.
Tracking vanity metrics instead of business results. Impressions and reach look good in reports, but if you're optimizing for purchases, focus on cost-per-conversion and ROAS, not engagement metrics.
Checking performance only once weekly. Weekly reviews miss budget pacing issues and performance shifts that happen mid-week.
Time vs Cost Calculation
Manual tracking costs €0 in tools but takes hours weekly. Automated tracking has monthly costs but returns those hours.
Whether automation makes sense depends on what your time is worth and how many accounts you manage.
Managing one simple account with weekly check-ins? Manual or Looker's free connector probably works fine.
Managing multiple client accounts with daily monitoring? The time savings from automation typically justify the cost in the first week.
The break-even point isn't universal, it's personal. Calculate your hours saved times your hourly value, then compare to monthly tool cost.


