
According to Dreamdata's 2025 LinkedIn Ads Benchmarks Report, LinkedIn Ads deliver the highest return on ad spend at 113% compared to Google Search (78%) and Meta (29%), yet most B2B teams can't prove this value because their reporting sucks. This guide covers seven practical reporting fixes that help you track real business outcomes instead of vanity metrics, properly attribute revenue to your campaigns, and build dashboards that actually inform decisions instead of just looking pretty in Slack.
Why LinkedIn Ads Reporting Is Different (And Harder)
If you've managed Facebook or Google Ads, LinkedIn will trip you up.
The B2B buying cycle averages 211 days. Someone from Company X sees your ad in March but never clicks. Their colleague closes a deal in October after three sales calls. Traditional last-click attribution credits the sales call, not your ad. You look like you wasted budget, even though you didn't.
LinkedIn now captures 39% of B2B advertising budgets in 2025 (up from 31% in early 2024). Your CFO wants to know why you're spending more than on Google Search. "Great engagement rates" won't convince them.
The good news? LinkedIn built tools specifically for B2B attribution. The bad news? Most teams set them up wrong.
Best Practice 1: Install the Insight Tag Properly (Or Lose 60% of Your Data)
The LinkedIn Insight Tag is a JavaScript snippet that enables conversion tracking, website retargeting, and demographic analytics. Without it, you have no idea what happens after someone clicks your ad.
The setup takes five minutes. Here's where teams screw it up:
- Place the tag before the closing
</body>tag on every page you want to track, not just landing pages. Your thank-you page, product pages, pricing page, and blog all need it. - Install through Google Tag Manager using LinkedIn's official template if you're managing multiple tags. This prevents the "wait, I thought you added that" conversation when your developer leaves.
- Test immediately: Go to Campaign Manager → Insight Tag → See Tag Health. If it shows "No activity detected" after 24 hours, your tag isn't working. Don't spend $5,000 to discover this.
For B2B lead generation campaigns, this isn't optional, it's your foundation.
Best Practice 2: Set Conversion Windows That Match Your Sales Cycle
LinkedIn's default conversion windows are 30 days for post-click and 7 days for view-through. Perfect for e-commerce. Completely wrong for enterprise B2B.
If your sales cycle is four months, you need longer windows. Campaign Manager lets you customize to 1, 7, 30, or 90 days.
Choose based on reality:
- Transactional products (under $500, quick decision): 7-day post-click, 1-day view-through
- Mid-market B2B ($5K-50K deals, 30-60 day cycle): 30-day post-click, 7-day view-through
- Enterprise deals (6+ month cycles): 90-day post-click, 30-day view-through
Too short and you underreport results. Too long and you credit conversions that had nothing to do with your ads.
Test different windows for three months, then pick what matches your CRM data. Don't change mid-campaign, it breaks comparisons.
Best Practice 3: Connect Your CRM for Revenue Attribution
Most teams report leads generated. Better teams report revenue influenced.
LinkedIn's Revenue Attribution Report syncs CRM data (Salesforce, HubSpot, or Microsoft Dynamics 365) with Campaign Manager. You see which campaigns influenced closed deals, not just form fills.
Three metric categories matter:
- Topline metrics: Revenue won, ROAS, and pipeline amount. This is what finance cares about.
- Funnel metrics: How LinkedIn-influenced leads move from MQL to SQL to closed-won. Shows where leads stall or accelerate.
- Conversion metrics: Lead conversion rate, opportunity win rate, average days to close. If you generate 500 leads at 2% conversion while Google generates 200 at 15%, fix your targeting, don't increase budget.
Integration takes 15 minutes with admin access. Data syncs automatically after setup (allow 48-72 hours for first results).
Critical: Revenue attribution tracks at company level. Person A from Company X sees your ad but never clicks. Person B from the same company closes a deal later. LinkedIn connects those dots. That's how buying committees actually work.
Best Practice 4: Choose the Right Attribution Model
LinkedIn offers two models. Most teams pick the wrong one.
Last-touch attribution gives 100% credit to the final clicked ad. Running four campaigns that someone engages with before closing? Only the last one gets credit.
This makes retargeting look amazing and awareness campaigns look terrible, even though prospects wouldn't enter your funnel without that initial exposure.
Each campaign attribution splits credit across every campaign. Four touchpoints = four conversions reported.
The trap: If one person converted but touched four campaigns, Campaign Manager shows four conversions. Your numbers look inflated.
When to use each:
- Last-touch: Direct response campaigns optimizing for immediate action (demo requests, trial signups)
- Each campaign: Full-funnel reporting where you need to understand how touchpoints work together
Never compare campaigns using different models. That's meaningless.
Best Practice 5: Build Dashboards Around Business Outcomes
Impressions and CTR help optimize creative. They don't prove campaign value.
Your dashboard answers one question: "Is this helping us hit revenue targets?"
Essential metrics:
- Cost per qualified lead (not just CPL, qualification matters)
- Lead-to-opportunity conversion rate by campaign
- Pipeline generated in dollars
- Cost per opportunity
- Revenue influenced and ROAS (90+ day campaigns only)
- Average deal size by campaign
Secondary metrics for optimization:
- CTR and engagement rate for creative testing
- Demographics (job function, seniority, company size) to validate targeting
- Frequency to catch ad fatigue
For multi-platform reporting, many teams pull LinkedIn data alongside Google Ads and Facebook into Google Sheets, Looker Studio, or Power BI. You can do this manually, use platform exports, or automate with tools like Dataslayer if pulling from multiple sources.
Reporting frequency: Check campaign performance weekly for budget adjustments. Evaluate strategy monthly. Daily obsessing over small CTR changes kills campaigns before they have time to work.
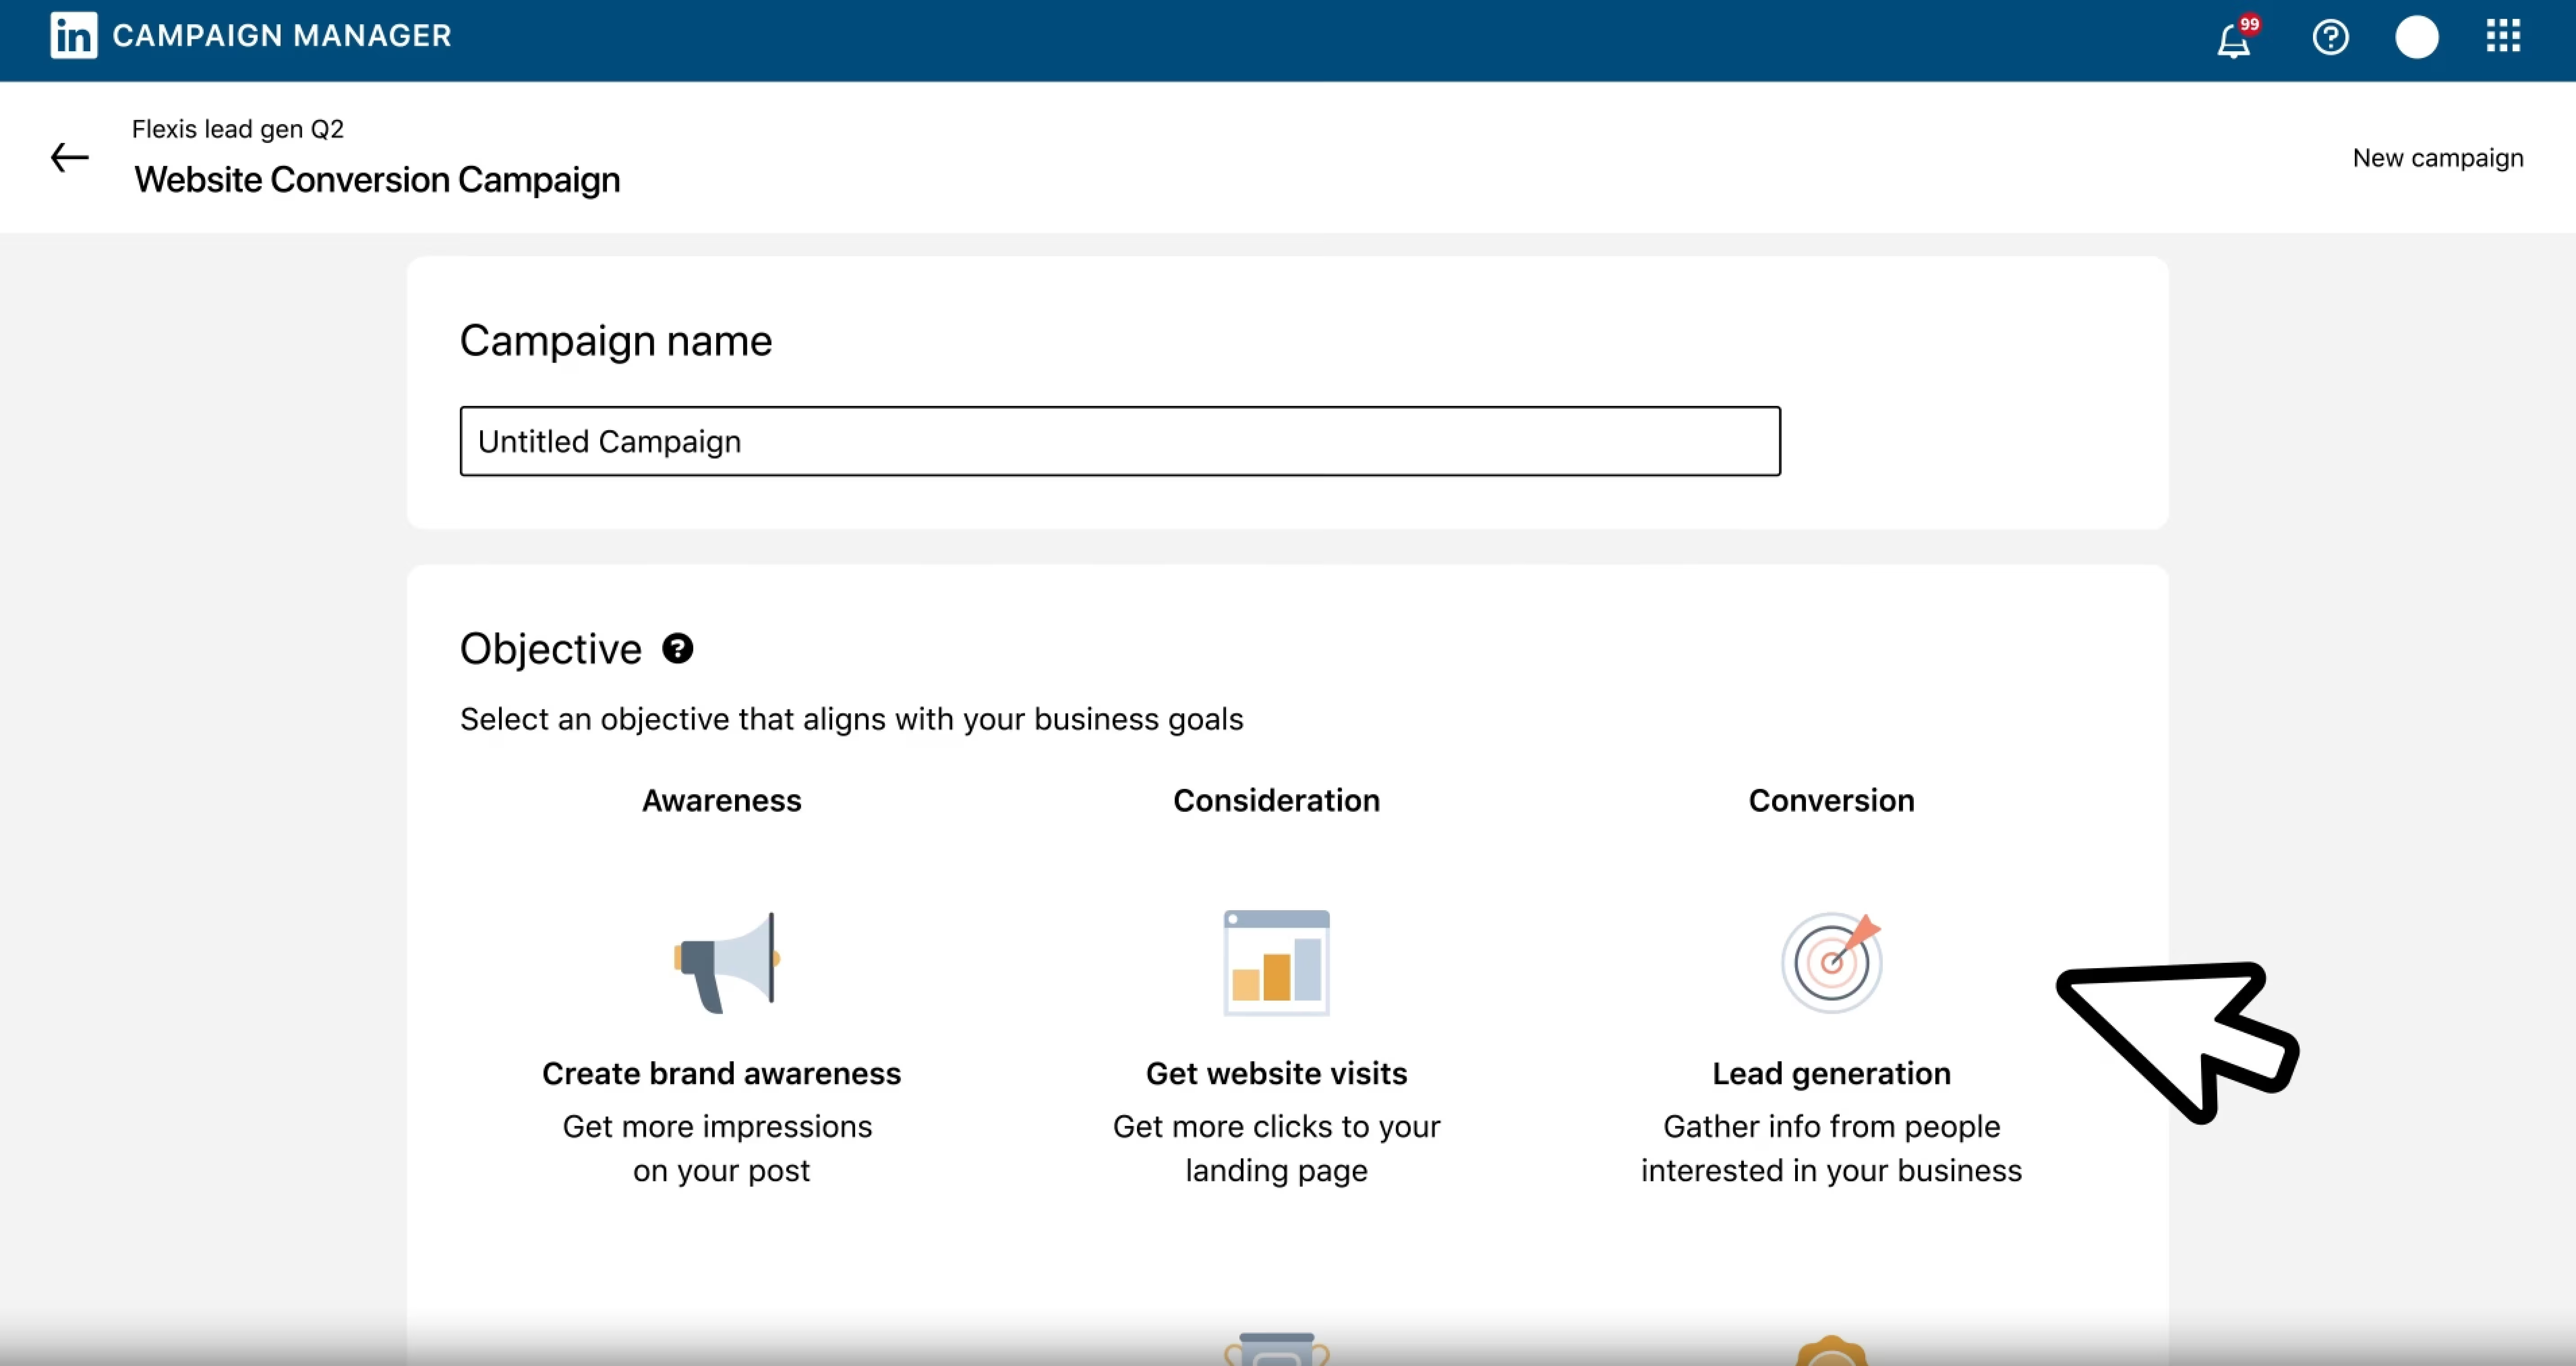
Best Practice 6: Segment Reporting by Campaign Objective
Comparing awareness campaigns against lead generation is pointless. They have different jobs.
Create separate views:
- Top-of-funnel awareness (Sponsored Content, video): Track reach, engagement rate, brand lift. Benchmark: 2-4% engagement for awareness campaigns.
- Mid-funnel consideration (retargeting, document ads): Focus on content download rate, time on site, return visitors. Benchmark: 15-25% document completion rates.
- Bottom-funnel conversion (Lead Gen Forms, Message Ads): CPL, lead quality scores, lead-to-opportunity rate. Benchmark: 10-25% form conversion rates.
Segmenting stops you from penalizing awareness campaigns for not generating leads.
Best Practice 7: Check On-Platform vs. Audience Network Weekly
Most advertisers don't realize: 60% of budget might go to LinkedIn's Audience Network instead of LinkedIn itself.
Audience Network extends ads to third-party sites. Quality varies. Many campaigns see worse performance from network placements than LinkedIn native inventory.
Check this: Campaign Manager → "Breakdown" → "On/Off Network"
If Audience Network CTR is below 0.3% or cost per conversion is 2x LinkedIn placements, exclude it.
Agencies sometimes push heavy network spend because it generates more impressions, making reports look better. But if clicks don't convert, you're burning money.
Common Reporting Mistakes That Cost You Money
Mistake 1: Reporting total leads without qualifying them. Sales doesn't care about 500 leads when 450 are students or competitors. Track qualified counts and get weekly sales input on quality.
Mistake 2: Falling for "each campaign" attribution inflation. If total conversions exceed your CRM count, you're double-counting.
Mistake 3: Ignoring view-through conversions. 33% of brands report increased purchase intent from LinkedIn exposure without clicks. Track clicks only and you miss a third of influence.
Mistake 4: Month-over-month comparisons without seasonality. Q4 enterprise buying differs from Q2. Compare both MoM and YoY.
Mistake 5: Using jargon executives don't understand. Report pipeline dollars, CAC, and payback period, not "MQL velocity."
How to Report to Executives
Leadership cares about business metrics, not marketing metrics.
Monthly executive report needs:
- Pipeline generated (dollars) vs. target and last month
- Cost per pipeline dollar
- ROAS for campaigns running 90+ days
- Top 3 campaigns with brief why-they-worked explanations
- One-sentence summary: "LinkedIn generated $480K pipeline at $0.23 per pipeline dollar, delivering 3.2x ROAS"
Keep it to one page. They'll ask for details if they want them. Most don't.
Frequently Asked Questions
What's a good cost per lead for LinkedIn Ads in B2B?
It depends on who you're targeting. Software companies targeting mid-market see $50-150 per lead. Enterprise targeting (Fortune 500 CXOs) runs $200-500 but converts at higher rates with bigger deals. What matters is cost per qualified lead, a $300 CPL converting to pipeline at 40% beats a $50 CPL at 5%. Track your lead-to-opportunity rate by campaign, then calculate real cost per opportunity.
How do I prove ROI when my sales cycle is 6+ months?
Connect your CRM to LinkedIn's Revenue Attribution Report to track influenced pipeline, not just closed deals. Report on pipeline generated and win rates while deals mature. For campaigns under six months old, use leading indicators: MQL-to-SQL rate, average opportunity size, sales qualification rate. Compare to other channels. Track pipeline milestones (meeting scheduled, demo completed, proposal sent) to show progress.
Should I use Campaign Manager or third-party attribution tools?
Both. Campaign Manager gives accurate platform data for optimization, creative testing, and audience analysis. Third-party tools (HubSpot, Bizible, Ruler Analytics) show how LinkedIn fits into your full buyer journey. You need Campaign Manager for daily optimization and attribution platforms for monthly revenue proof.
How often should I pull reports?
Weekly for budget pacing, performance issues, and creative fatigue. Monthly for full targeting/messaging evaluation. Quarterly for ROAS on long sales cycles. Over-reporting leads to premature campaign changes that kill statistical significance. Set thresholds (CTR below 0.4%, frequency above 4, CPL up 50% week-over-week) and only act when you hit them.
What's the difference between native reporting and dashboard tools?
Campaign Manager has all platform data but needs manual exports for history or cross-channel comparison. Tools like Dataslayer, AgencyAnalytics, or Databox auto-pull LinkedIn data with Google Ads, Facebook, etc. into unified dashboards. Great for agencies with multiple clients or teams reporting across platforms. Tradeoff: $50-200/month cost and occasional API limits.
How do I report when conversions happen offline?
Upload offline conversions to your CRM with source attribution. Let CRM-LinkedIn integration connect them. Use unique phone numbers or promo codes in ads. For events, create dedicated landing pages with UTM parameters and track registrations as conversions. Add conversation tracking in your CRM where reps log how prospects found you, report assisted conversions instead of last-touch.
What metrics should I stop reporting?
Impressions (unless pure awareness), reach, reactions/likes/shares (unless testing virality), and audience size (that's planning data). These distract from business impact. Every reported metric should answer: "Did this help us hit revenue goals?"
Focus on What Actually Matters
Good LinkedIn Ads reporting answers: What should we do differently next month?
If your report doesn't lead to clear actions, shift budget, kill underperformers, adjust targeting, refresh creative, it's just documentation.
Start with the business outcome (pipeline, revenue, qualified leads), work backward to LinkedIn metrics that predict it, ignore everything else.
For more tips on optimizing LinkedIn campaigns, check our guide to LinkedIn Ads success strategies.
Want to automate this? Try Dataslayer free for 15 days to connect LinkedIn Ads to Google Sheets, Looker Studio, BigQuery, or Power BI, with no credit card required.


