
.avif)
TikTok generated $23 billion in ad revenue in 2024, up 43% from the previous year according to ByteDance's financial reports. Engagement rates sit at 4.07%, over 4x higher than Instagram. If you're running TikTok Ads, the platform clearly works.
The problem is knowing how well it's working.
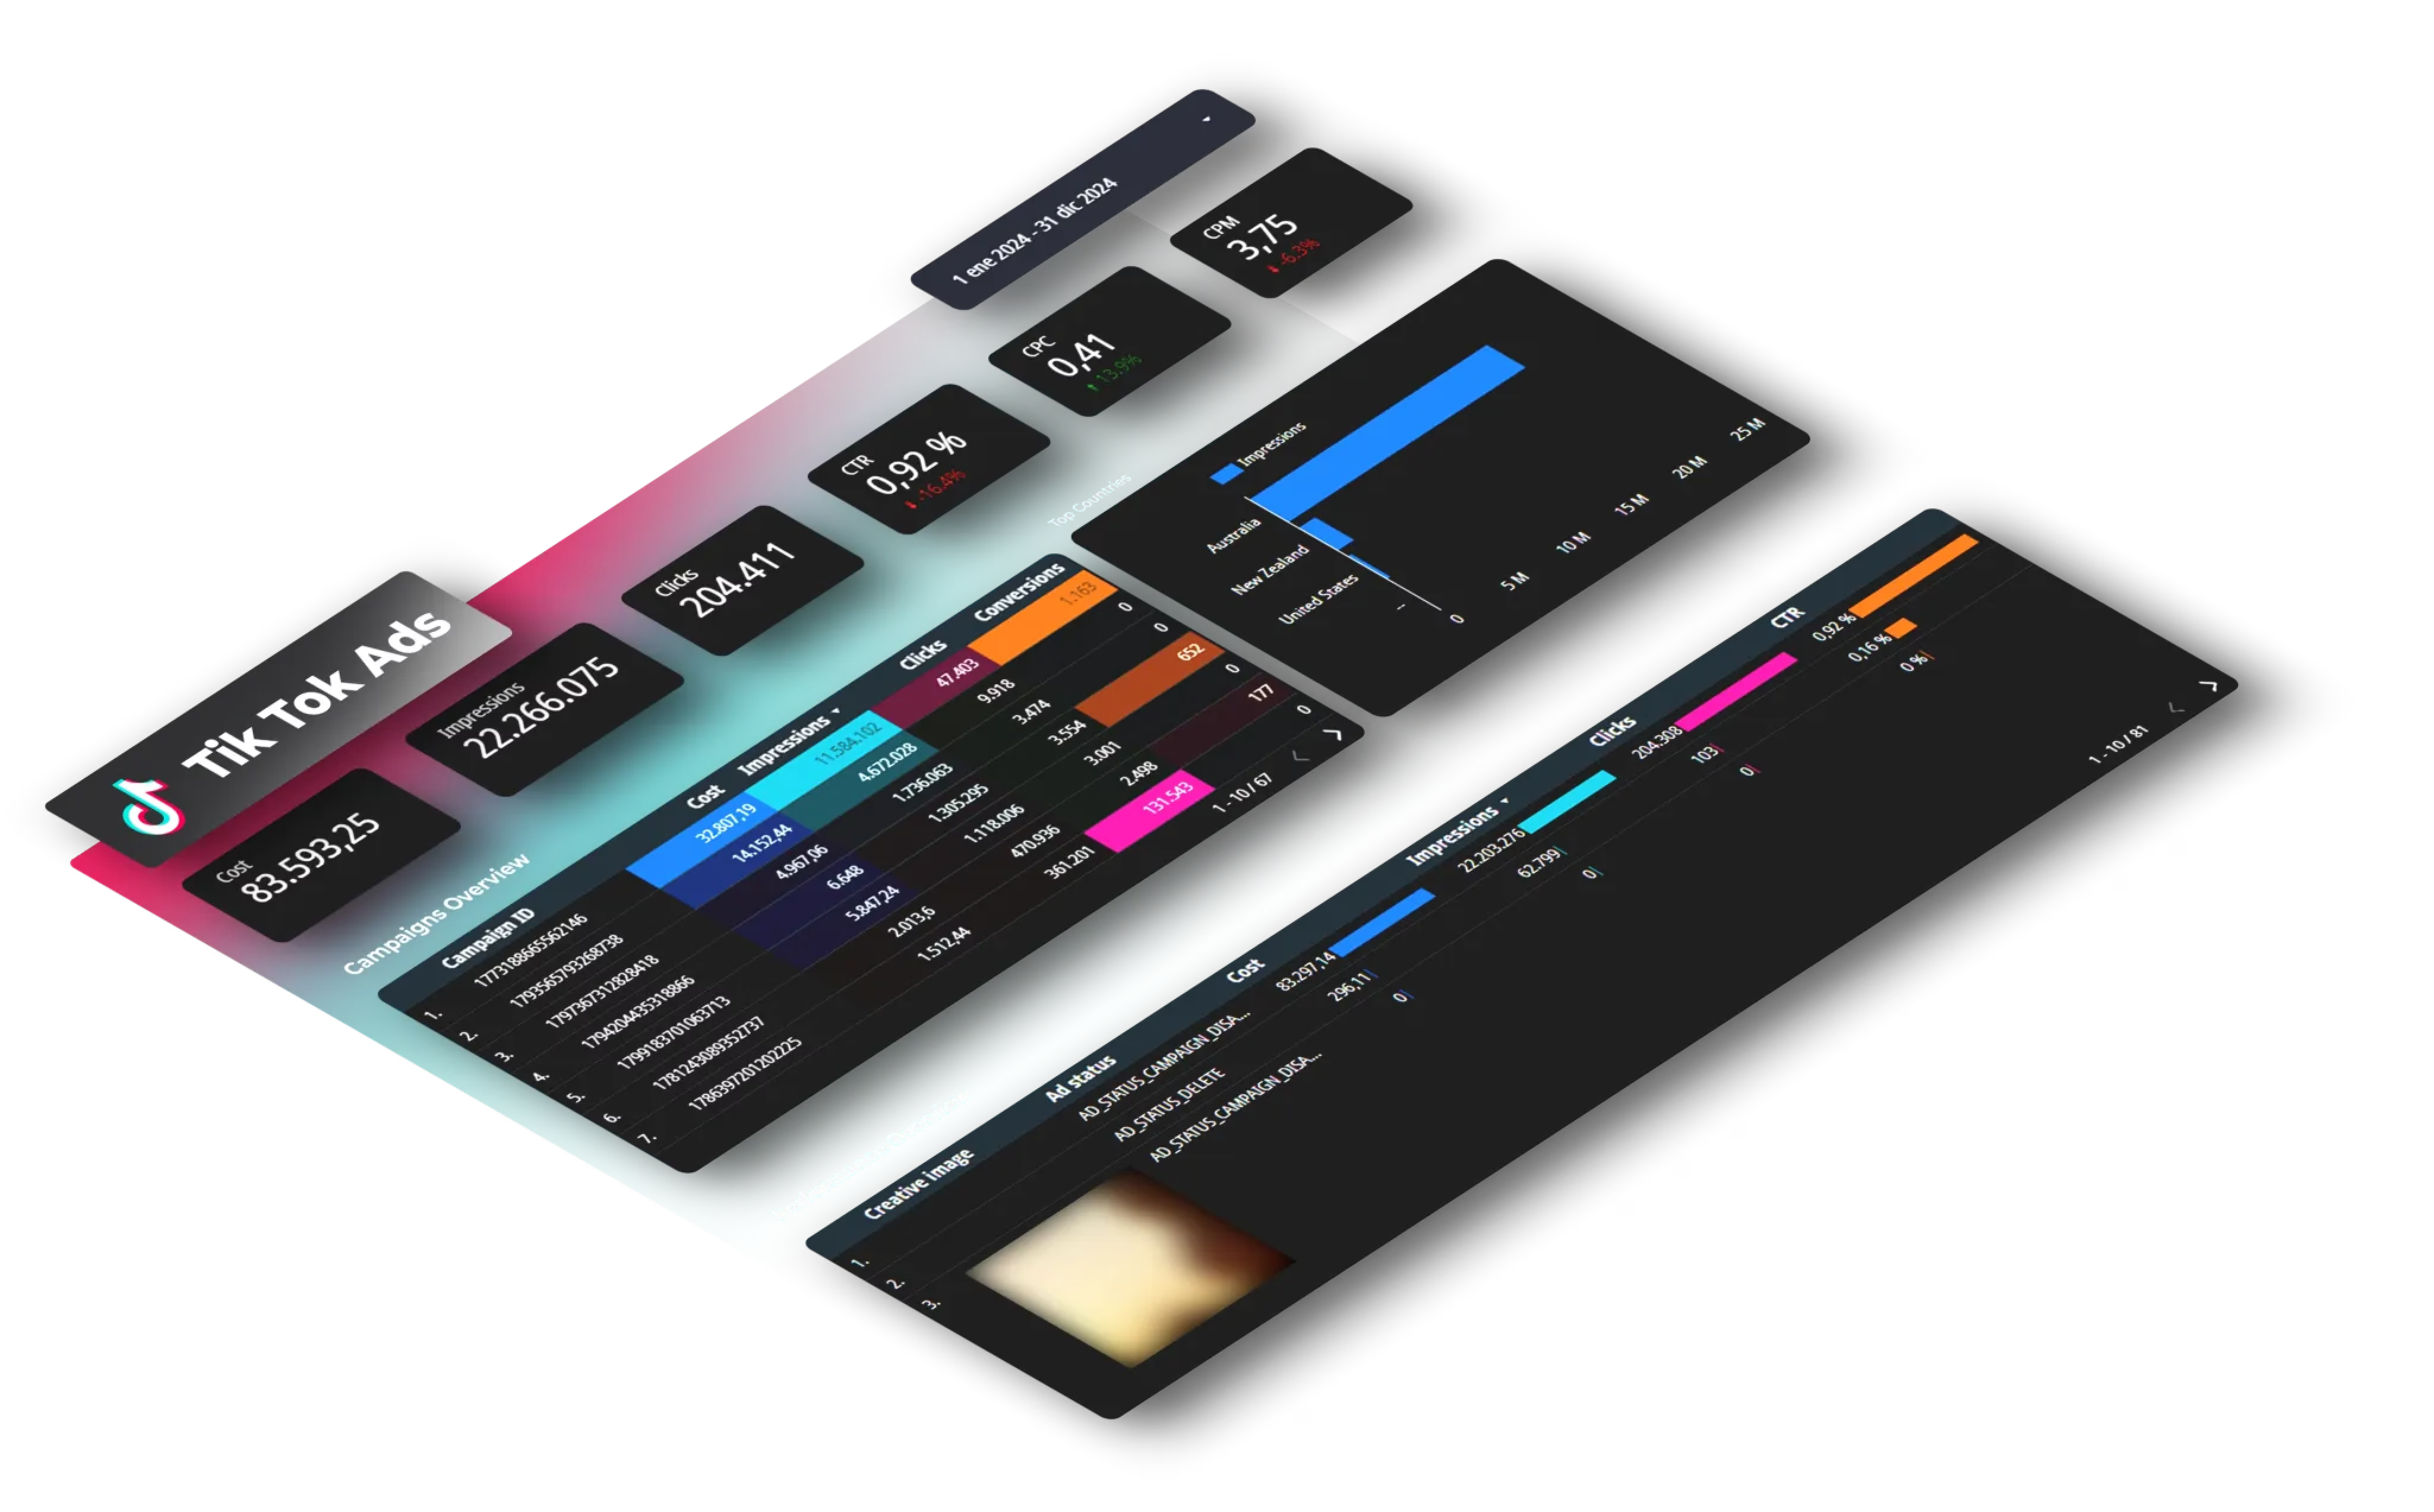
TikTok Ads Manager shows over 400 metrics across campaigns, ad groups, and individual ads. Impressions, clicks, 6-second video views, engaged views, complete payments, GMV, which ones actually predict whether you'll hit your targets? And when you're also running Meta and Google campaigns, how do you compare performance without opening three separate dashboards?
We've built TikTok Ads reports for e-commerce brands spending $50k monthly and B2B companies testing their first $500 campaign. Here's what we've learned: most marketers track the wrong metrics entirely, optimizing for views and engagement while missing the conversion data that determines profitability.
This guide covers the TikTok Ads reporting metrics that matter in 2025, verified benchmarks by industry, and how to build automated dashboards that update daily without manual CSV exports.
Why TikTok Ads Reporting Requires a Different Approach
TikTok's video-first format means standard ad metrics don't tell the complete story. A 0.8% CTR that would be mediocre on Facebook might be excellent on TikTok, depending on your video completion rate.
According to TikTok's official help documentation, the platform tracks "engaged view" conversions, when someone watches your ad for 6+ seconds with focus, then converts within 1-7 days (you set the attribution window). This captures 30-40% of conversions that last-click models miss entirely.
The bigger challenge: TikTok Ads Manager only shows TikTok data. If you're running campaigns across multiple platforms simultaneously, which most brands are, you need separate dashboards to see complete performance.
The 8 TikTok Ads Metrics That Predict Campaign Success
Skip vanity metrics. Here's what actually moves the needle.
1. Click-Through Rate (CTR)
Benchmark: 0.5-1.5% (average 0.84%)
Your TikTok CTR will typically be lower than Facebook but higher than display ads. According to Lebesgue's 2025 benchmark analysis, conversion-optimized TikTok ads average 0.84% CTR.
Industry breakdown:
- E-commerce: 0.9-1.2%
- B2B/Finance: 0.5-0.7%
- Beauty: 1.0-1.5%
If you're below your industry average, your hook (first 2 seconds) isn't stopping the scroll.
2. 6-Second Video Views (Engaged View)
What matters: 40%+ of impressions reaching 6 seconds
This is TikTok's key engagement signal. Videos achieving 6-second views on 40%+ of impressions typically show stronger conversion performance than those under 20%, regardless of total view count.
Why 6 seconds matters: TikTok uses this threshold for engaged view attribution. Someone who watches 6+ seconds and converts within your attribution window (default 7 days) counts as a conversion, even without clicking.
3. Video Completion Rates (25%, 50%, 75%, 100%)
Diagnostic framework:
- Drop at 25% = Hook failed
- Drop at 50% = Middle lacks momentum
- Drop at 75% = Weak payoff/CTA
- High 100% completion but low clicks = Entertainment without conversion
For direct response ads, target 30%+ completion at the 50% mark.
4. Cost Per Click (CPC)
Benchmark: $0.20-$2.00 (median $0.50)
According to Varos March 2025 benchmark data, the median TikTok CPC is $0.50, 40-50% cheaper than Facebook ($1.72) and 70% cheaper than Instagram ($3.56).
Industry variance from MarketingLTB's 2025 analysis:
- E-commerce: $0.40-$0.80
- Beauty & Personal Care: $0.50-$0.90
- Food & Beverage: $0.60-$1.20
- Finance/Insurance: $1.50-$3.00
- SaaS/Tech: $1.00-$2.50
If your CPC exceeds these ranges, either creative relevance is low or you're in an expensive auction. Test broader targeting or new creative angles.
5. Cost Per Mille (CPM)
Benchmark: $3-$15 (average $8.30)
MarketingLTB's 2025 analysis reports global average CPM around $8.30, with significant geographic variance:
- US: $10-$20 for competitive objectives
- UK/EU: $6-$12 mid-range
- Southeast Asia/India: $2.50-$6
CPM matters most for awareness campaigns optimized for reach. If consistently above $15, consider less saturated markets or shift budget to off-peak hours.
6. Conversion Rate (CVR)
Benchmark: 0.46-5% depending on industry
According to Lebesgue's conversion benchmark data, average conversion rates cluster around 0.46%. Industry variance:
- E-commerce: 1.5-3.0%
- Beauty: 2.0-4.0%
- Food delivery/DTC: 2.5-5.0%
- Finance/B2B: 0.3-1.0%
- SaaS: 0.5-2.0%
Diagnostic framework:
- Good CTR + Low CVR = Landing page problem
- Low CTR + Good CVR = Wrong audience, right message
- Both low = Misalignment across creative-offer-audience
7. Return on Ad Spend (ROAS)
Benchmark by vertical (from Swydo's 2025 industry data):
- Food & Beverage: 3.5x
- E-commerce/Beauty: 2.5-3.0x
- Fashion: 2.8x
- Finance: 1.2x
Short-cycle products show immediate ROAS. Longer consideration purchases display lower ROAS but higher customer lifetime value, track both in your reporting.
8. Engagement Rate
Benchmark: 4.07-4.56%
TikTok's engagement rate (likes + comments + shares + follows divided by impressions) significantly outperforms other platforms. According to Brandwatch's 2025 statistics, TikTok averages 4.07% engagement, compared to Instagram's 1.22% and Facebook's 0.09%.
High engagement doesn't guarantee conversions, but it's a strong leading indicator. Content that resonates tends to convert better once you nail the CTA.
TikTok's Unique Reporting Metrics You Won't Find Elsewhere
GMV Metrics (For TikTok Shop)
If you're selling through TikTok Shop, these metrics override standard conversion tracking:
- GMV Orders: Completed TikTok Shop orders attributed to ads
- GMV Gross Revenue: Total Shop revenue from ad-driven sales
- GMV ROI: Return on investment from Shop campaigns
- GMV Cost Per Order: Average cost per completed order
According to our TikTok Shop analytics analysis, successful campaigns achieve 3-5x ROI with CPO ranging from $8-$25 for consumables.
SKAN Metrics (iOS Attribution Post-iOS 14.5)
For iOS app install campaigns, TikTok provides full SKAN (StoreKit Ad Network) data including:
- SKAN conversions by conversion value
- SKAN ROAS
- SKAN cost per install
This gives attribution visibility that many platforms struggle to surface after iOS privacy updates.
Engaged View Attribution Windows
TikTok offers three attribution windows you can customize:
- Click attribution: 1-day to 28-day
- View attribution: 1-day to 7-day
- Engaged view attribution: 1-day to 7-day (6+ second focused watch)
According to our analysis of TikTok's Smart+ attribution update, 79% of conversions attributed to TikTok were missing from last-click attribution models. Reporting with extended windows reveals the platform's true impact.
Building Automated TikTok Ads Reporting Dashboards
Here's how to move from manual exports to automated reporting that updates daily.
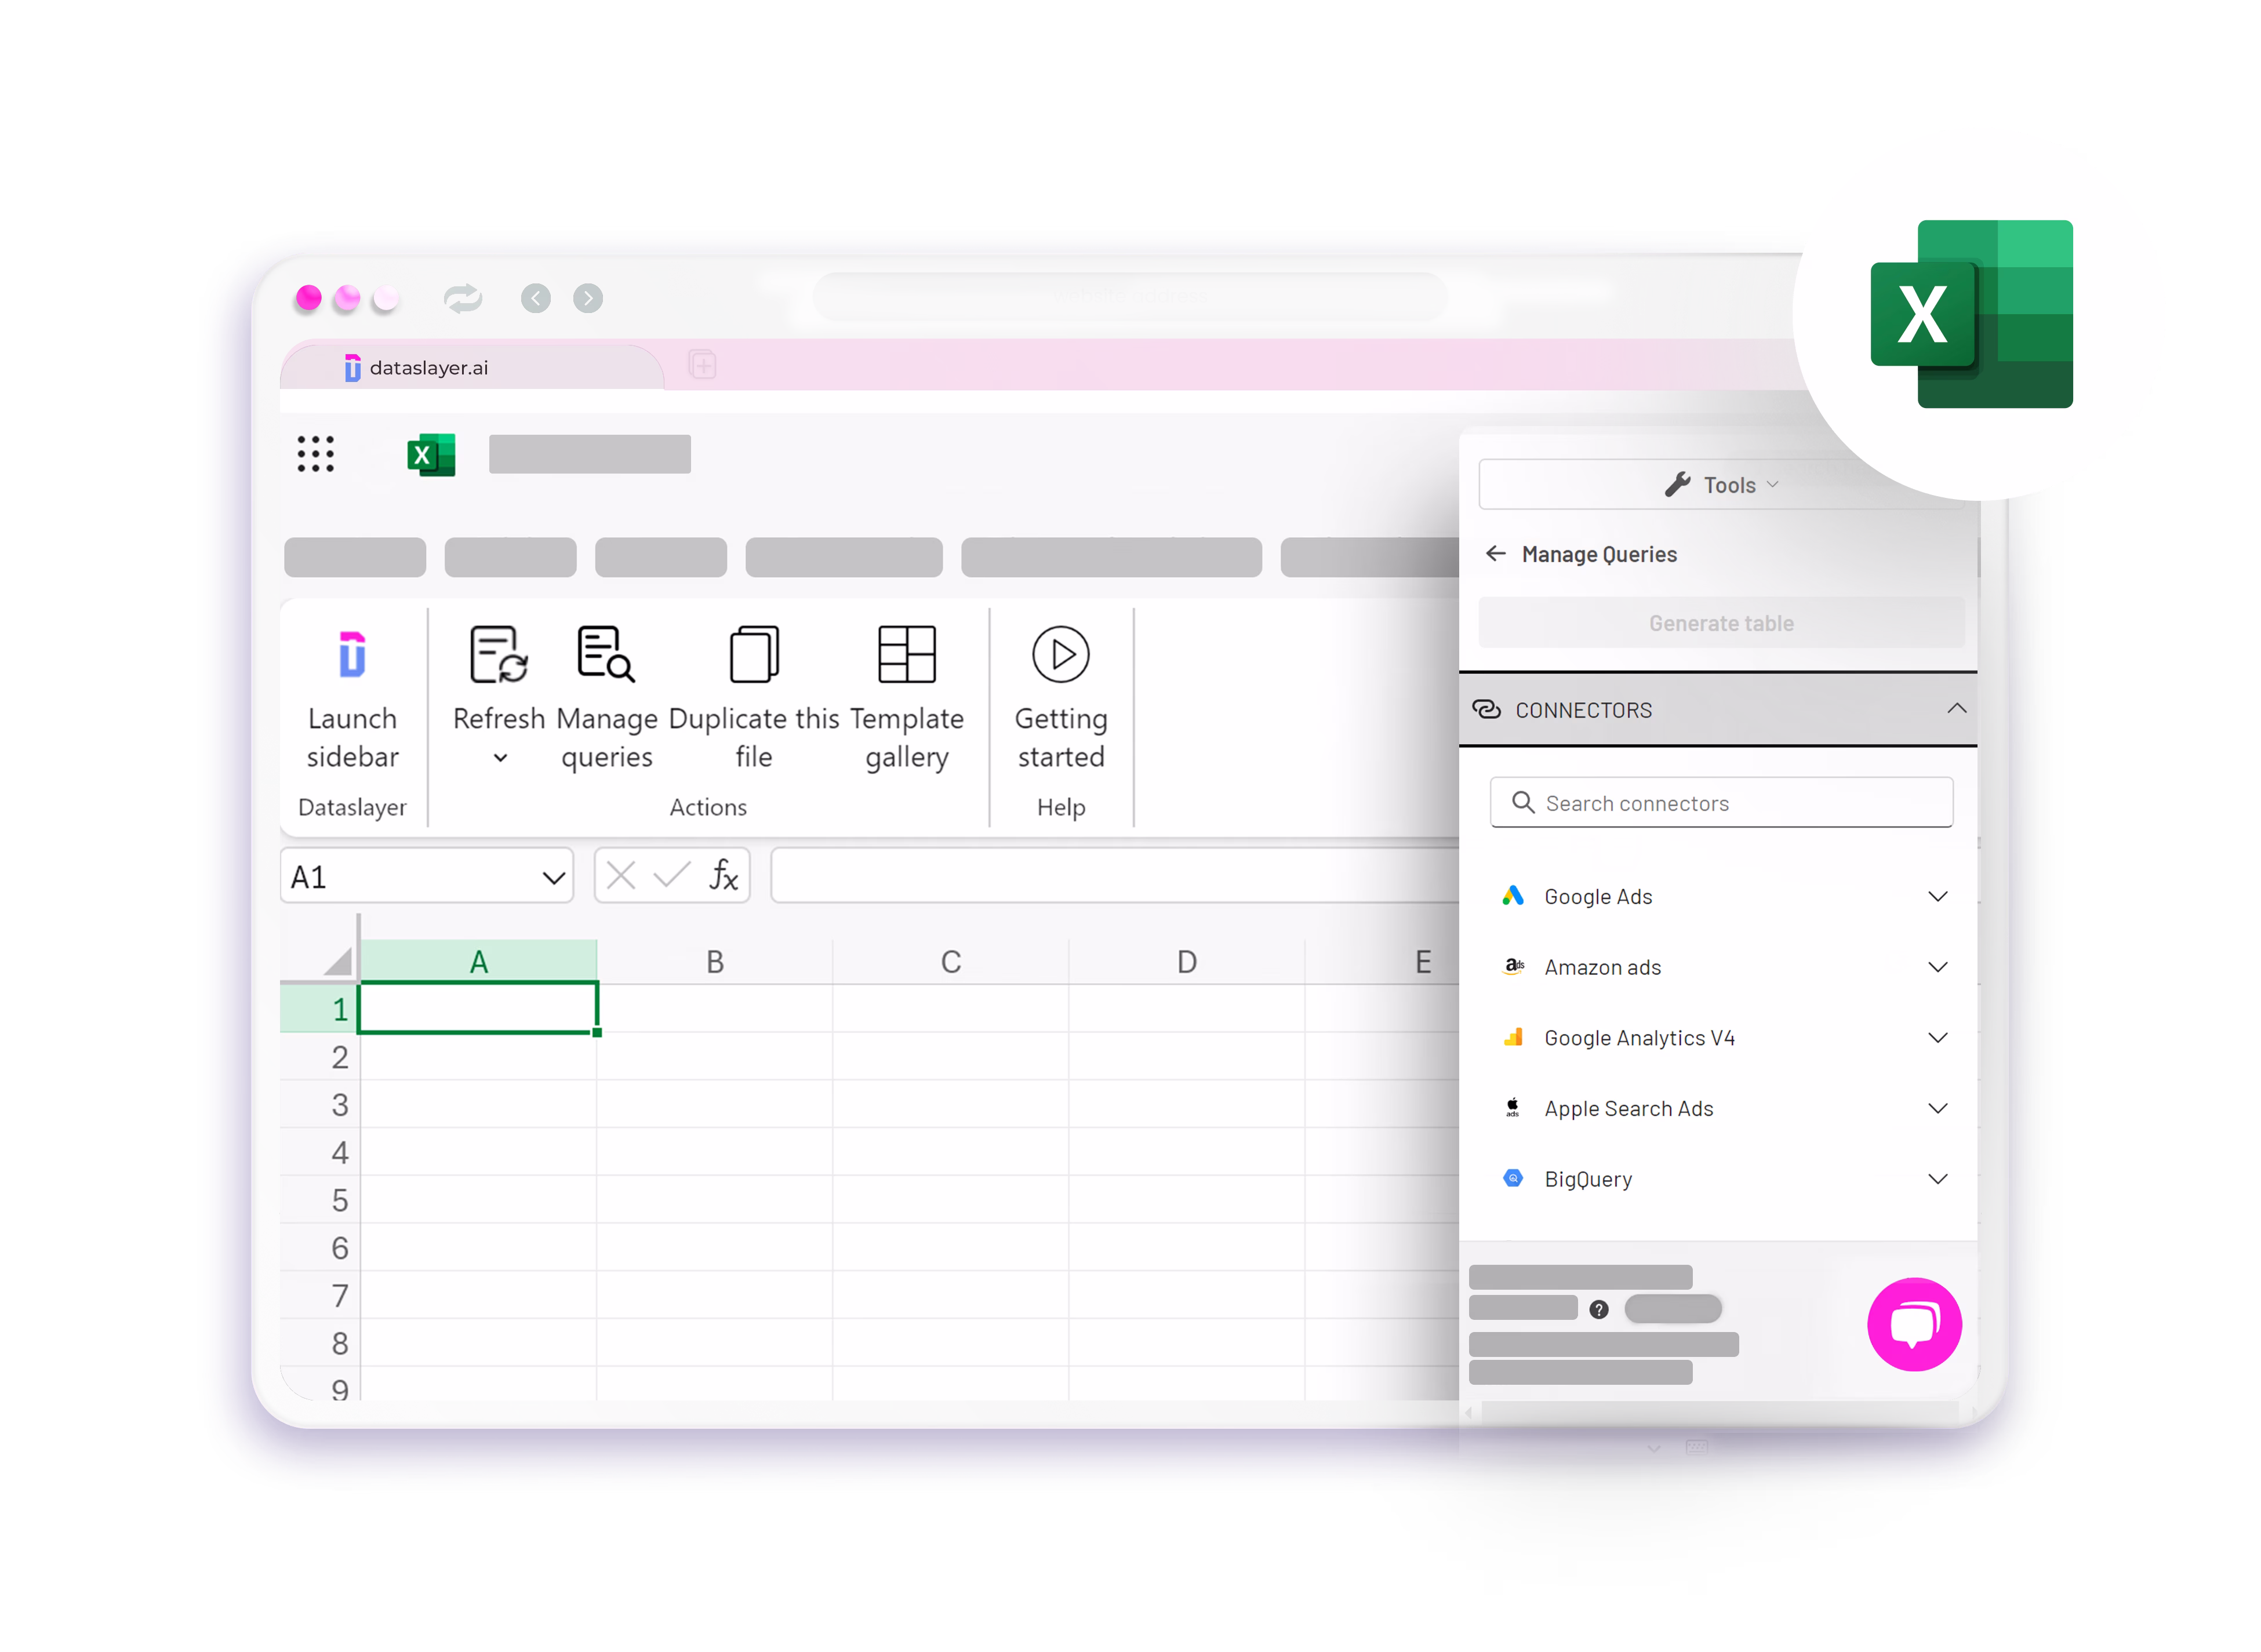
Step 1: Connect Your Data Source
Authenticate your TikTok Ads account and select the advertiser accounts you're tracking. If managing multiple clients, connect all accounts simultaneously, you can filter by advertiser in your dashboards.
Step 2: Define Your Essential Metrics
For your first dashboard, start with these core data points:
Dimensions:
datecampaign_namead_group_namead_name
Core performance metrics:
impressions,clicks,ctrspend,cpc,cpmconversions,conversion_rate,cost_per_conversion
Video-specific metrics:
video_watched_6s(engaged views)video_views_p50(50% completion)engagement_rate
E-commerce (if applicable):
complete_paymenttotal_purchase_valuecomplete_payment_roas
Step 3: Choose Your Reporting Platform
Most marketing teams use one of these approaches:
Looker Studio (formerly Google Data Studio): Free, integrates with Google ecosystem, unlimited dashboards. Best for agencies with multiple clients.
Google Sheets: Simple, familiar interface. Good for teams already using spreadsheets for analysis.
Power BI or Tableau: Enterprise-grade visualization. Worth it if you're already paying for these tools.
The reporting platform matters less than having automated data flow. Manual CSV exports break down within two weeks, someone gets busy, forgets one day, and reporting falls behind.
Step 4: Build or Use Pre-Built Templates
Skip manual dashboard building. Pre-configured templates include:
- Performance overview (spend, conversions, ROAS)
- Campaign breakdown with trend analysis
- Creative performance by engagement and conversion
- Video completion tracking
- Hourly/daily heatmaps for schedule optimization
You can start with ready-made templates and customize them for your specific KPIs.
Step 5: Add Cross-Platform Comparison
The real value is combine TikTok with Google Ads, Meta Ads, and GA4 in the same dashboard. Now you can answer "which platform delivers the best ROAS for our audience?" without switching tabs or merging spreadsheets.
Real TikTok Ads Reporting Use Cases
E-Commerce & DTC Brands
Challenge: Track both TikTok Shop GMV and website conversions, then calculate blended ROAS across all channels.
Solution: Dashboard combines Shop metrics (GMV orders, revenue) with website pixel events (complete payment, purchase value). Filter by creative format to identify whether UGC, product demos, or testimonials drive highest conversion.
App Install Campaigns
Challenge: Optimize for both install volume and post-install quality (registrations, purchases, D7 retention).
Solution: Track app_install and cost_per_app_install alongside in-app events (registration, purchase, total_purchase_value). Calculate effective CPA by qualified actions, not just installs. Use SKAN metrics for iOS attribution.
Common finding: Lowest CPI campaigns often show weaker D7 retention. Reporting makes it easy to optimize for retention instead of install volume.
Lead Generation (B2B, Finance, Education)
Challenge: TikTok drives high CTR but lead quality varies significantly by targeting.
Solution: Track form submissions and sales_lead conversions with cost per lead by campaign. If CRM-connected, monitor lead-to-SQL conversion rate. Compare TikTok lead quality against LinkedIn and Google.
Key insight: TikTok leads typically show lower intent than search but higher than social display. Reporting helps find the targeting sweet spot where volume meets quality.
Multi-Location Businesses
Challenge: Running campaigns for 50+ locations with different performance by geography.
Solution: Filter by province_name or dma_name (Designated Market Area). Compare CPM and conversion rates by location. Identify saturated markets (high CPM, low CTR) versus underserved areas (low CPM, high engagement). Reallocate budget to top-performing regions based on data rather than assumptions.
How to Optimize Based on Reporting Data
Reporting only matters if it changes decisions.
If CTR < 0.84%: Test new hooks in the first 2 seconds. According to our TikTok algorithm analysis, videos with strong hooks in the first 3 seconds tend to receive more algorithmic distribution. Start with motion, pattern interrupts, or direct camera address.
If CPM > $15: Broaden targeting (narrow audiences create expensive auctions). Match creative style to native TikTok content, polished ads often underperform authentic-looking content. Test different campaign objectives.
If CVR < industry benchmark: Audit landing page speed (target under 2 seconds on mobile). Verify offer matches ad promise exactly. Check attribution window, extend to 7-day click to capture delayed conversions. Consider tightening targeting if quality suffers.
If Video Views at 50% < 30%: Cut intro sequences. Front-load value in first 10 seconds. Speed up pacing, TikTok attention spans run shorter than YouTube based on platform data.
If Engagement Rate > 5% but CVR < 1%: Strengthen the CTA in both video and caption. Bridge entertainment-to-action gap. Consider two-step funnel: high-engagement ads for awareness, then retarget engagers with direct-response ads.
Common TikTok Ads Reporting Mistakes
Mistake #1: Only tracking last-click conversions
TikTok often serves as a discovery touchpoint, not the final click. If you only credit last-click attribution, you undervalue TikTok by 30-40%. Include view-through and engaged-view conversions in reporting.
Mistake #2: Comparing TikTok to Google Search
TikTok is interruption marketing (like Facebook), not intent-based (like Search). Expecting Google-level conversion rates makes TikTok look ineffective. Compare TikTok to Meta Ads or YouTube, platforms with similar user mindset.
Mistake #3: Ignoring video-specific metrics
Many marketers only track CTR, CPC, and conversions, missing TikTok's unique video data. A 0.6% CTR with 60% video completion at 50% outperforms 1.0% CTR with 20% completion. Video metrics predict long-term creative sustainability.
Mistake #4: Not filtering by campaign status
Including paused or deleted campaigns in aggregate reports creates misleading metrics. Always filter for campaign_status = "ENABLE" and ad_status = "ENABLE" in reporting queries.
Mistake #5: Using reach-based metrics in aggregate
According to TikTok's reporting documentation, the platform can't sum reach across ad groups or campaigns because it eliminates duplicates. Report reach at campaign level only, or use impressions for aggregate reporting.
The Future of TikTok Ads Reporting
TikTok advertising continues evolving rapidly. The platform launched Search Ads in 2025, and according to TikTok's official announcement, total searches grew 40% year-over-year with 86% of Gen Z searching TikTok weekly.
This shift means reporting needs to capture both:
- Traditional campaign performance (awareness, consideration, conversion)
- Search performance (keywords, search terms, intent-based conversions)
Our TikTok Search Ads vs GMV Max guide covers this in detail, but the key takeaway: reporting complexity increases as TikTok adds new campaign types and attribution models.
Automated reporting isn't optional anymore. Manual reporting breaks down as campaign complexity grows.
Start Automating Your TikTok Ads Reporting
TikTok generated $23 billion in ad revenue in 2024, projected to reach higher in 2025. With engagement rates 4x higher than Instagram and CPCs 40-50% lower than Facebook, the platform delivers results.
But results only matter if you can measure them accurately. When you can see which campaigns, ad groups, and creatives drive actual ROI, not just engagement, you make better budget decisions.
Manual reporting doesn't scale past 2-3 campaigns. CSV exports break down when someone gets busy. Spreadsheet formulas break when platforms change field names.
Automated TikTok Ads reporting solves this:
- Daily updates without manual work
- Cross-platform comparison (TikTok + Meta + Google)
- Historical data preserved even if TikTok changes reporting
- Team access without sharing logins


