
Shopify's built-in analytics cover the basics well enough when you are starting out. But as your store grows, you start hitting walls: you cannot join order data with ad spend, you cannot build customer cohorts, you cannot query anything that Shopify's dashboard does not already show you. The moment you find yourself exporting CSVs and pasting them into spreadsheets to answer a single question, it is time to move your Shopify data into a proper data warehouse.
BigQuery is the most common destination for this because it is serverless, scales to any data volume, integrates natively with GA4 and Google Ads, and works directly with Looker Studio for visualization. This guide covers the three realistic ways to get Shopify data into BigQuery, which one makes sense depending on your team, and the full setup steps using Dataslayer.
Why Shopify merchants move data to BigQuery
The questions that push teams toward BigQuery are usually the same. Which marketing channels are actually driving profitable orders, not just orders? What is the lifetime value of customers acquired through different campaigns? Which products have the highest return rates and how does that affect net revenue? How do seasonal cohorts compare across years?
None of these questions are answerable from Shopify alone. They require joining order data with ad spend, session data, or product cost information that lives in different systems. BigQuery gives you a place to bring all of that together and query it with SQL, without the performance constraints of spreadsheets or the data retention limits of individual platforms.
There is also the operational side: manual CSV exports are brittle. They depend on someone remembering to run them, they create versioning issues, and they break the moment your data volume grows past what a spreadsheet can handle. An automated pipeline into BigQuery solves all of that at once.
Three ways to connect Shopify to BigQuery
There is no single right answer here. The best method depends on your team's technical capacity, how many data sources you are dealing with, and what you want to do with the data once it is in BigQuery.
The custom code route gives you maximum control but requires ongoing engineering time to handle Shopify's API rate limits (40 requests per minute, 250 records per request), pagination, schema changes, and backfills. It is the right choice if you have very specific data requirements that no pre-built connector covers.
The native BigQuery Data Transfer Service connector is a solid option if you are already comfortable in Google Cloud Console. It supports several sources including Google Ads and GA4, but its Shopify connector is limited in the depth of data it provides, and each source requires its own independently configured transfer. If your goal is a unified ecommerce and marketing data pipeline, that adds up quickly in complexity.
A connector like Dataslayer is the practical choice for most ecommerce teams because it handles Shopify alongside every other data source in one place. You set up the pipeline once, schedule automated transfers, and have Shopify orders in the same BigQuery project as your Google Ads campaigns, Meta Ads spend, and GA4 sessions without any additional tooling.
How to connect Shopify to BigQuery with Dataslayer
The setup takes a few minutes. You need a Dataslayer account, a Google Cloud project with BigQuery enabled, and your Shopify store credentials.
Step 1. Create a BigQuery project and dataset
If you do not already have one, go to Google Cloud Console and create a new project. Then open BigQuery from the left menu and create a dataset inside that project. Give it a name you will recognize, like shopify_data or ecommerce_warehouse. Keep note of the project ID and dataset name as you will need them in Dataslayer.
One important setting: do not enable table expiry unless you explicitly want data deleted automatically after a set number of days. Leave that option off to avoid losing historical data.
Step 2. Connect Shopify in Dataslayer
Log into your Dataslayer account and go to the BigQuery product. Click New Transfer. Select Shopify as your data source and authenticate with your Shopify store. Dataslayer connects via the official Shopify API using secure OAuth authentication. Your store and customer data is never stored on Dataslayer servers: it flows directly from Shopify into your BigQuery dataset.
Step 3. Configure your transfer
Select the Shopify account and store you want to pull data from. Then choose the data you want to export: orders, customers, products, inventory, and refunds are all available. Select the date range for the initial historical import. For most stores, pulling 12 to 24 months of history gives you enough data for meaningful cohort analysis from day one.
On the destination side, select your BigQuery project and dataset. Set the write mode to Append so that each scheduled run adds new data without overwriting what is already there. Give your transfer a descriptive name.
Step 4. Schedule automated updates
Set a refresh frequency. Daily is sufficient for most reporting use cases. If you need more frequent updates, you can also run transfers manually or on a custom schedule. Once the schedule is set, Dataslayer handles everything automatically. Your Shopify data in BigQuery stays current without any manual intervention.
The steps above apply to any data source in Dataslayer. The following video shows the full setup process, but the flow is identical for Shopify: select your source, configure the transfer, set your BigQuery destination, and schedule it.
Step 5. Add your other data sources
This is where a connector tool has a clear advantage over the native BigQuery option. Within the same Dataslayer interface, you can add Google Ads, Meta Ads, GA4, or any of the 50+ other supported connectors and send them all to the same BigQuery project. Each source has its own transfer with its own schedule, all managed from one place. No separate pipelines, no separate tools.
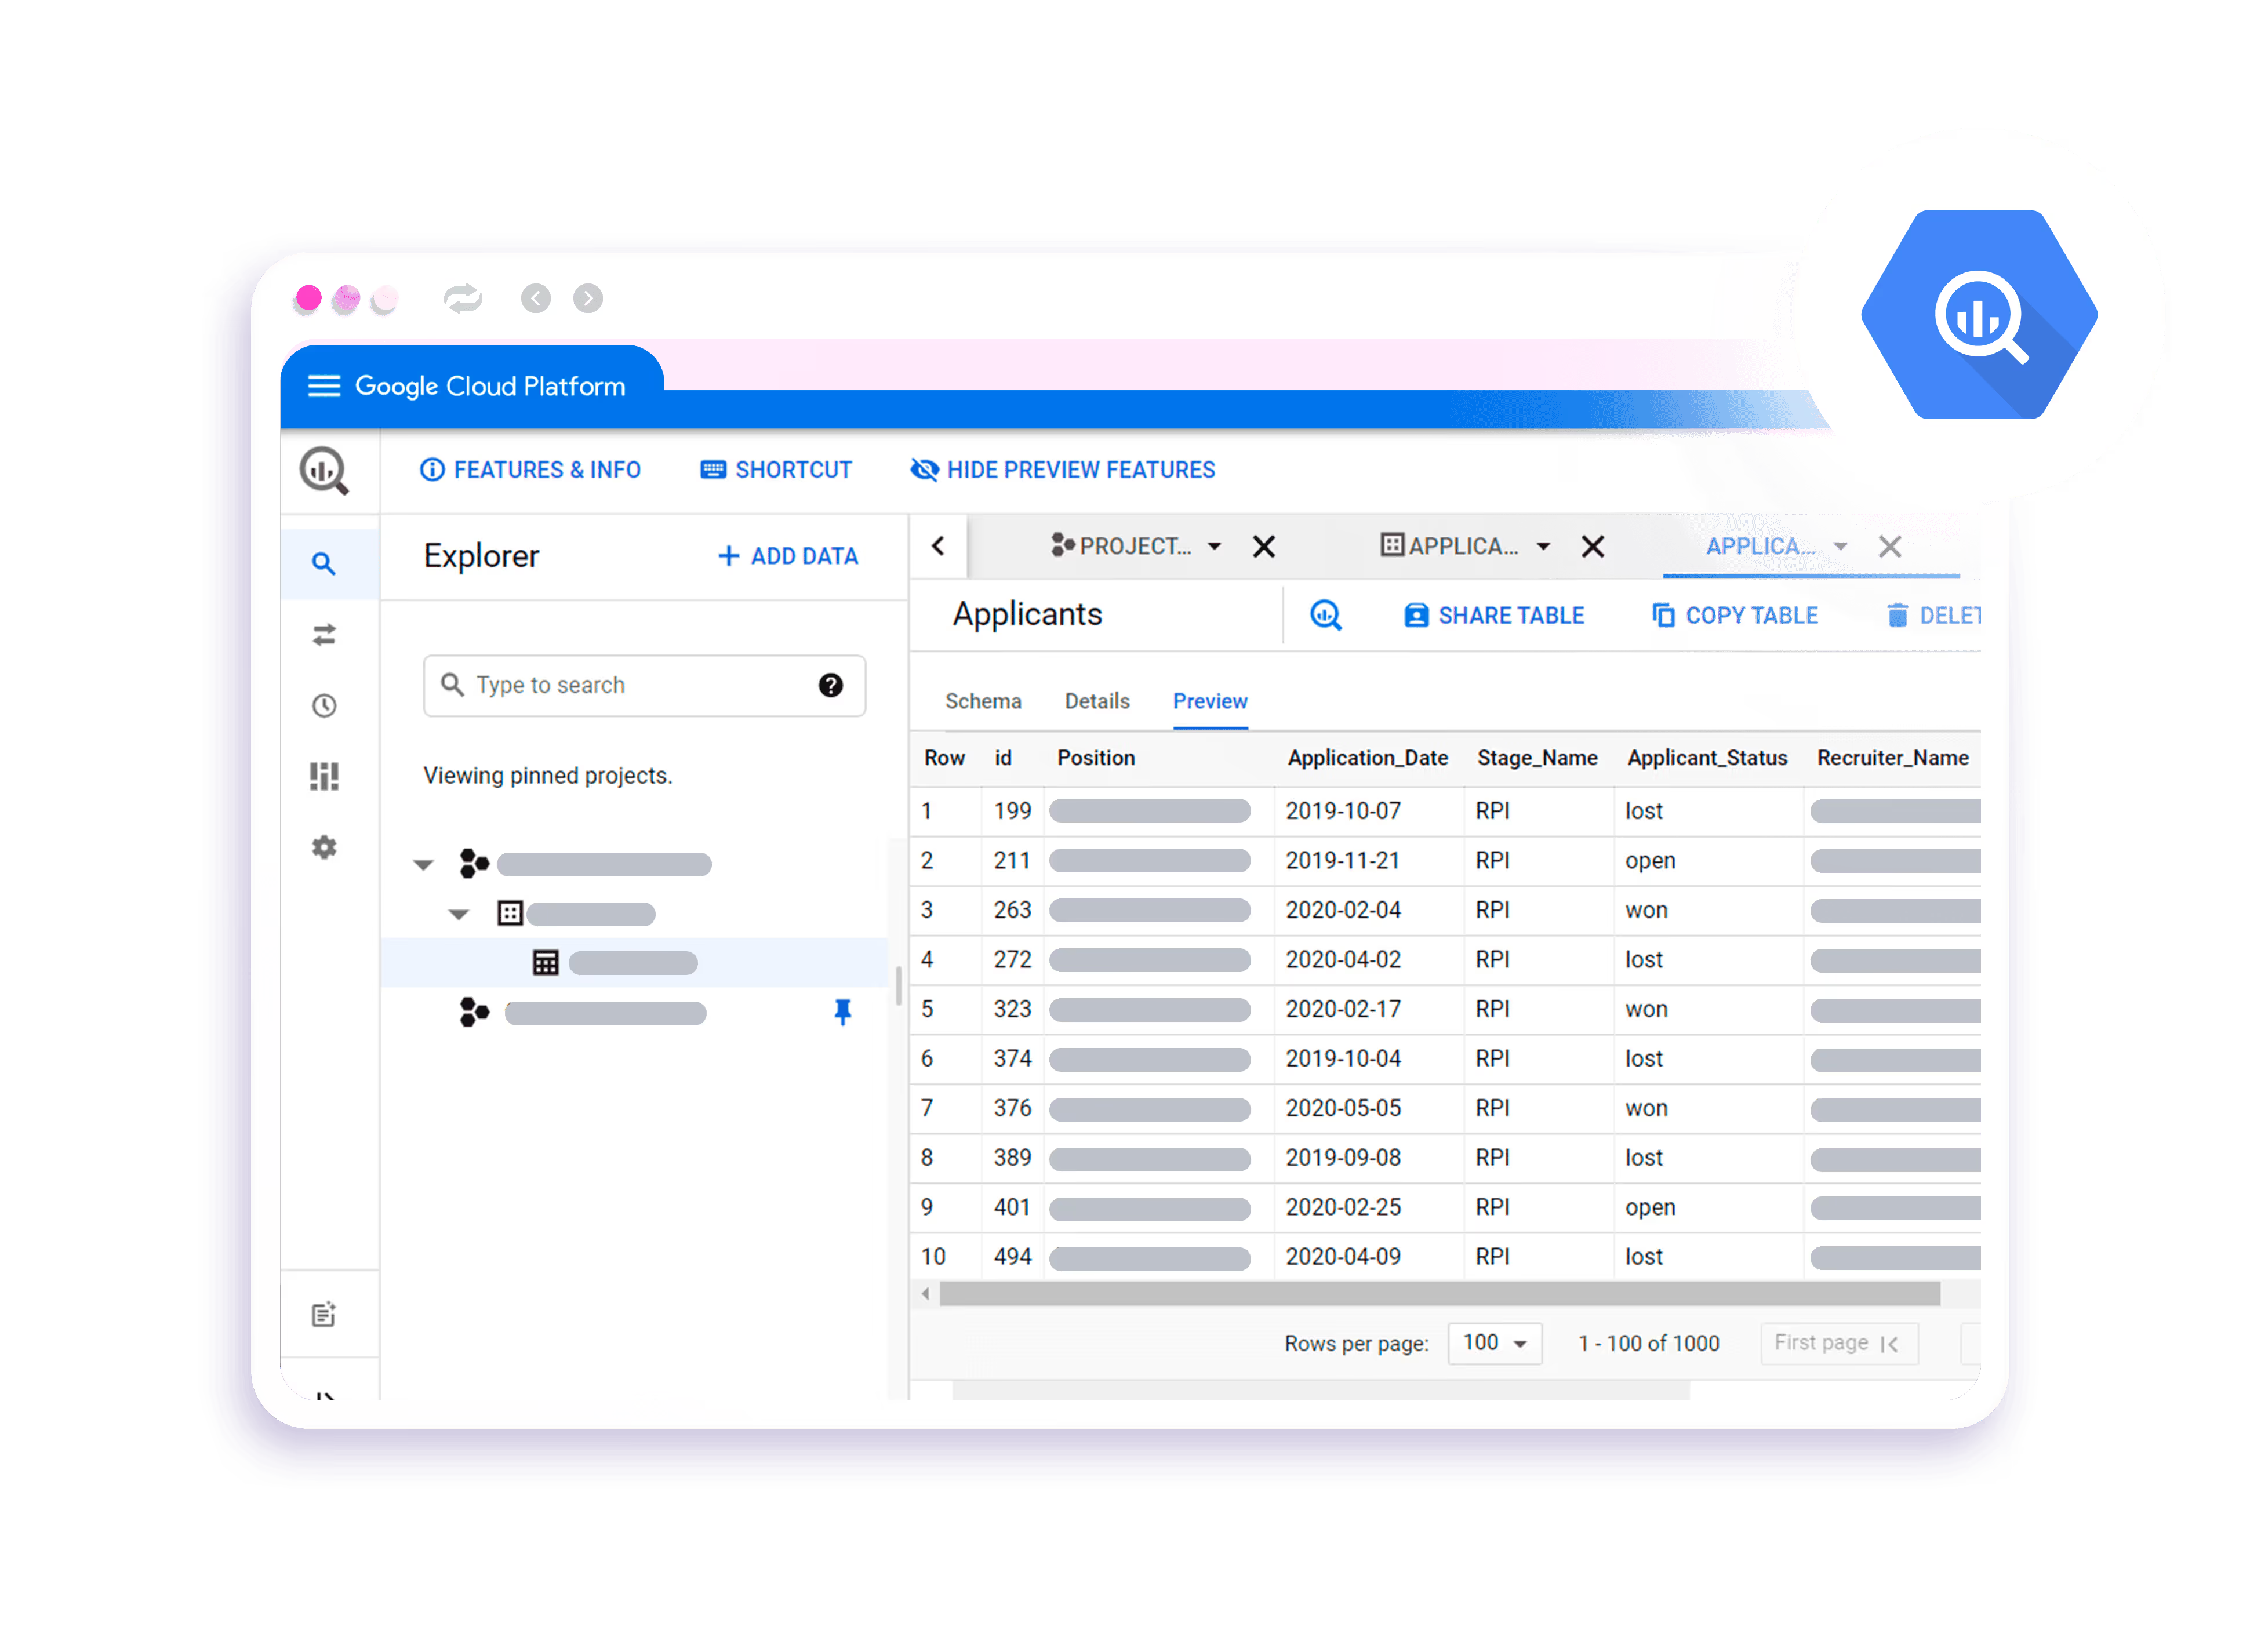
What Shopify data lands in BigQuery
Dataslayer pulls the following data from Shopify into your BigQuery dataset:
- Orders: order ID, order name, creation date, processed date, financial status, fulfilment status, source channel, UTM parameters (source, medium, campaign, content), referring URL, currency, and location data.
- Customers: customer ID, email, country, city, order count, lifetime value, new vs. returning status, and RFM group.
- Products: product ID, name, title, SKU, variant, price, vendor, type, status, and inventory cost.
- Order financials: total sales, gross sales, net sales, gross profit, shipping charges, total tax, discounts, returns, and average order value.
- Inventory: product variant quantity in stock and inventory item cost.
All of this arrives as structured data ready to query with SQL or join with other sources in the same BigQuery project.
What you can build once Shopify is in BigQuery
The setup is straightforward. The interesting part is what becomes possible once your Shopify data is in the warehouse and you can start joining it with everything else.
True ROAS by channel
Join your Shopify orders table with your Google Ads and Meta Ads spend tables using the order date and UTM parameters. Instead of relying on platform-reported ROAS (which is attribution-model dependent and often inflated), you calculate revenue generated per channel directly from order records. The result is a single number you can trust: actual Shopify revenue divided by actual ad spend, by campaign.
Customer lifetime value by acquisition source
Group customers by their first order date and acquisition channel. Track subsequent orders over 30, 60, 90, and 180 days. This tells you not just which campaigns drive the most first-time buyers, but which ones drive buyers who come back. A campaign that looks expensive on first-purchase CPA might be your best performer on 6-month LTV.
Cohort analysis across seasons
Because BigQuery holds unlimited historical data, you can compare the same cohort behavior across different years. How do customers acquired during last year's Black Friday compare to those from two years ago in terms of repeat purchase rate and average order value? These are questions that require more data history than Shopify's dashboard retains and more compute than a spreadsheet can handle.
Refund rate by product and channel
Join the orders and refunds data with product data to calculate net revenue by SKU. Join that with ad spend to see which campaigns are driving sales with high return rates. A product with a 30% refund rate from paid traffic significantly changes the profitability calculation that any ad platform's native reporting ignores.
Connecting BigQuery back to your reporting tools
Once Shopify data is in BigQuery, you have several options for visualization and reporting. Looker Studio connects directly to BigQuery tables and lets you build live dashboards that refresh automatically. Analysts can write SQL queries in BigQuery and export results to Google Sheets for sharing with non-technical stakeholders. For teams already using Power BI, BigQuery connects natively through the Google BigQuery connector in Power BI Desktop.
Dataslayer also works in the other direction: the BigQuery connector lets you query your warehouse tables and pull results back into Google Sheets or Looker Studio, so your marketing team can work with the processed data without needing direct BigQuery access. This is useful when analysts build the models in BigQuery and marketers consume the results in familiar tools.
If you are new to setting up BigQuery for ecommerce reporting, our Shopify to Google Sheets guide covers the lighter-weight alternative for teams that do not yet need a full data warehouse setup.


