


You already have the data. Google Ads, Meta, GA4, LinkedIn, TikTok: it's all there, somewhere. The problem isn't access. It's that turning numbers into an actual answer still takes 20 minutes of tab-switching, filtering, and mental math every time.
Dataslayer MCP changes that. Instead of navigating dashboards, you ask a plain-English question and get an answer pulled from your live marketing data, directly inside Claude or ChatGPT. This guide covers 5 practical ways to use it, from building queries without touching documentation to generating client-ready summaries on demand.
What Is the Dataslayer MCP?
MCP (Model Context Protocol) is an open standard created by Anthropic. As the official MCP documentation explains, it works like a USB-C port for AI applications: a single standardized connection that lets any compatible AI assistant talk to any external data source.
Dataslayer's MCP server sits between your AI assistant and your marketing accounts. When you ask "what was my CPA on Google Ads last week?", the AI sends a structured request to Dataslayer, Dataslayer pulls the data from the platform, and the answer appears in your chat, based on today's numbers, not a spreadsheet exported last Tuesday.
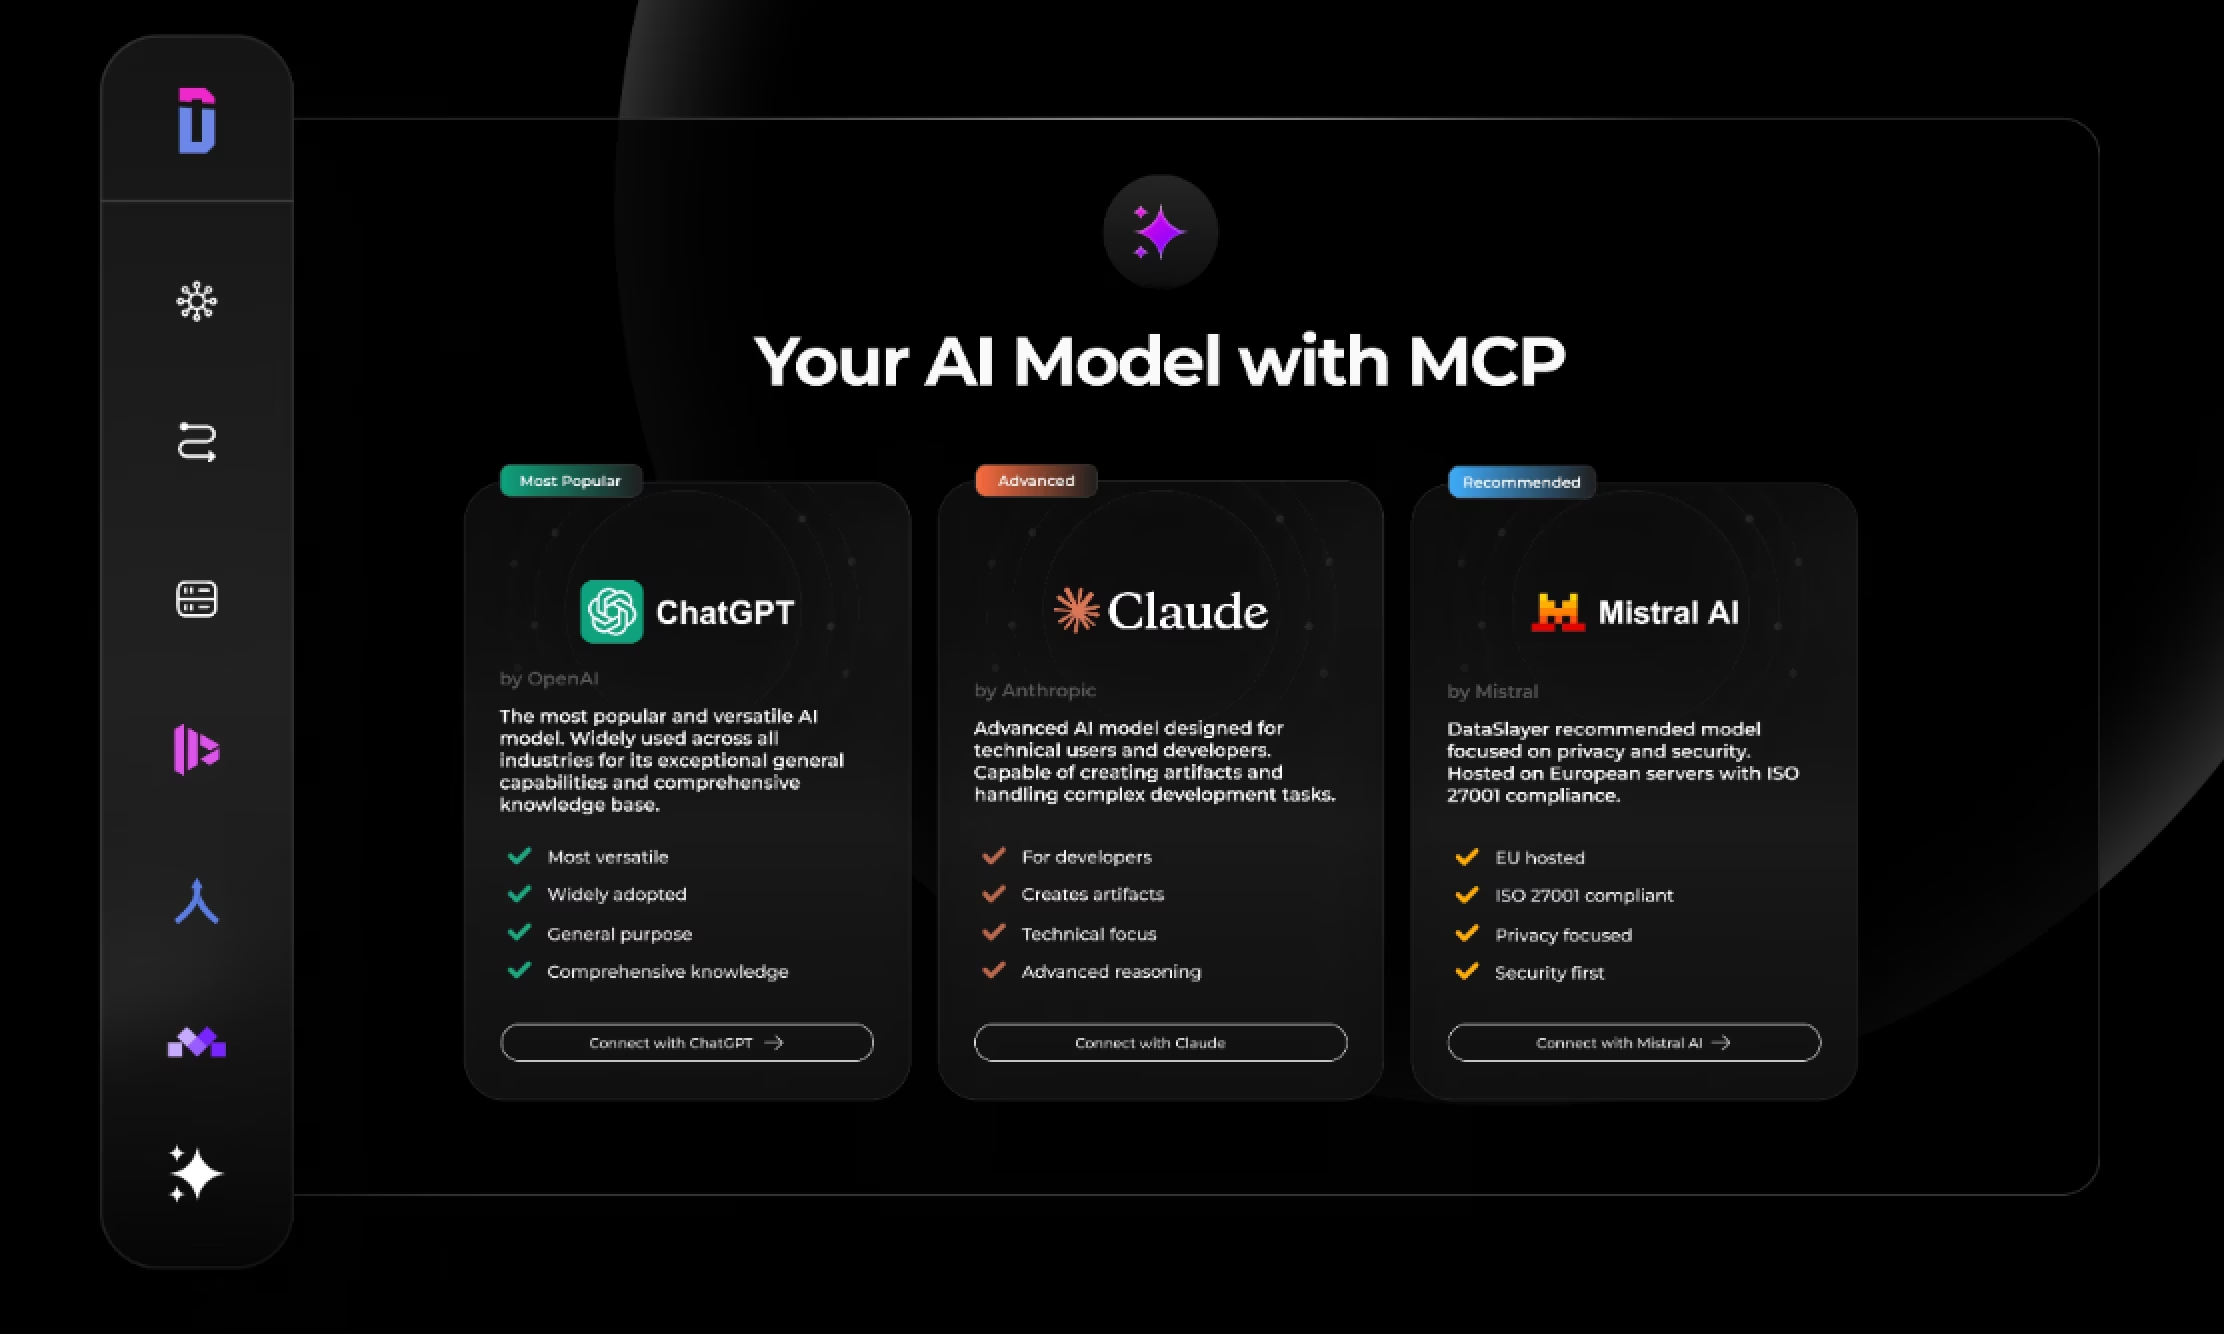
The integration works with Claude, ChatGPT, and Mistral. You configure it once; it works across all three. Setup instructions are on Dataslayer's MCP page and, for Claude specifically, in Anthropic's official MCP setup guide.
Use Case 1: Build Queries Without Reading the Documentation
When you need specific data, cost and CPA by campaign for Search only, segmented by device, figuring out how to structure that query normally means reading connector docs or asking your data team. With Dataslayer MCP, you describe what you want and the AI builds the query for you.
Example prompts:
- "Build a Dataslayer query for Google Ads: cost, conversions, and CPA by campaign, last 30 days, Search campaigns only, broken down by device."
- "I want Facebook Ads data showing ROAS by ad set, filtered to ad sets with spend over €500 this month. How would that query look?"
- "Create a GA4 query: sessions and conversion rate by landing page, last 7 days, organic traffic only."
The AI returns a query structure with the right field names and filter logic as a starting point. You don't need to know which dimensions are compatible with which metrics, or how date ranges are formatted in each connector, though it's worth a quick sanity check on field names before running it.
This is especially useful when onboarding a new client account or working with a connector you haven't used before.
Use Case 2: Have a Conversation With Your Data to Find Insights
Most dashboards show you numbers. They don't tell you which ones matter this week, what changed, or what to do about it. That interpretation step, from metrics to meaning, is still manual. With Dataslayer MCP, you can work through it conversationally.
Example prompts:
- "Which Google Ads campaigns had a CPA above €50 this week, and how does that compare to last week?"
- "What was the best-performing Meta Ads audience in terms of ROAS last month?"
- "I'm running campaigns on Google Ads, Meta, and LinkedIn. Which channel had the lowest cost per lead last month?"
- "Show me the top 5 keywords by conversions this month. Which ones also have a below-average CPC?"
The AI pulls the data, does the comparison, and gives a plain-language answer. You can follow up in the same conversation, "Why do you think the CPA increased for that campaign?" or "What's the share of spend on that audience versus the others?", without starting over.
To illustrate: a dashboard tells you CPA increased 18% week-over-week. Following up conversationally can surface that it's driven by two specific mobile campaigns where CTR dropped while CPCs held flat. The numbers were always there; the conversation makes them actionable.
Use Case 3: Spot Anomalies Without Configuring Alert Rules First
Automated alerts require you to define the rule before the problem happens. You have to know what to watch for in advance. Dataslayer MCP lets you check for anomalies on demand, for any metric, without any prior setup.
Example prompts:
- "Has anything unusual happened in my Google Ads spend this week compared to the previous two weeks?"
- "Are there campaigns where CTR dropped more than 20% between last week and this week?"
- "Which Meta ad sets had a sudden spike in frequency in the last 7 days?"
The AI scans your data and flags outliers without needing pre-defined thresholds. Useful for quick health checks during busy periods: launches, promotions, end of quarter, when you want a fast read across accounts without opening each platform individually.
Use Case 4: Cross-Platform Comparisons in a Single Question
Comparing performance across channels is one of the most time-consuming parts of any reporting workflow. Google Ads and Meta don't share a common interface. LinkedIn uses different terminology. Attribution windows vary by platform. Manually aligning this to answer "which channel drove the most leads this month?" can take an hour.
With Dataslayer MCP, it's one prompt.
Example prompts:
- "Compare CPA across Google Ads, Meta Ads, and LinkedIn Ads for the last 30 days. Which channel is most efficient for leads?"
- "I'm running the same offer on TikTok and Meta. Which platform had a better conversion rate last week?"
- "Show me total spend and total conversions by channel for Q1. Which had the lowest cost per conversion?"
The AI pulls from each connector and synthesizes a unified answer. No spreadsheet, no copy-paste, no manual column alignment. For a deeper look at cross-channel attribution methodology, this guide on building multi-channel dashboards in Looker Studio covers how to set up persistent cross-platform reporting alongside the MCP.
Use Case 5: Generate Performance Summaries on the Spot
At the end of the week or month, someone needs a summary. That usually means opening each platform, pulling the key numbers, writing them up, and formatting everything, using data that's already stale by the time you paste it into a doc.
With Dataslayer MCP connected, you generate that summary in one prompt, from live data.
Example prompts:
- "Write a weekly performance summary for our Google Ads and Meta campaigns. Include total spend, leads, CPA, and any notable changes versus last week. Keep it under 300 words."
- "Summarize this month's paid media performance across all channels for a client unfamiliar with marketing metrics. Focus on what worked and what we're adjusting."
- "Create a short executive summary of GA4 traffic for last month: sessions, top sources, and conversion rate by channel."
The AI writes the summary using the actual numbers it just pulled. You can refine tone, length, and focus in follow-up messages without re-pulling the data.
What the MCP Doesn't Replace
Dataslayer MCP is a conversational analysis layer. Sessions are exploratory and real-time. If you need a dashboard that refreshes automatically for a client to check every morning, that's still what Dataslayer's persistent connectors are for.
The MCP is where you find the insight. The connector delivers it automatically after that.
For more context on where AI-driven data analysis is heading, this post on marketing analytics trends covers what's already changing in 2026.
Getting Started
- Log into your Dataslayer account
- Go to dataslayer.ai/mcp and copy your server URL
- Add it to Claude (Settings, Integrations, MCP Servers) or ChatGPT (Custom GPT, Actions)
- Ask your first question
The authorization persists once set up. Every conversation in Claude or ChatGPT has live access to your marketing accounts from that point forward, no re-authentication, no re-uploading files.


