

Pinterest Ads sits in an awkward position in most marketing dashboards. The native Pinterest Ads Manager view is functional for high-level metrics, but the moment you want to break down Performance+ campaign behavior, compare Pinterest spend to other paid channels, or see how Pinterest contributes to a cross-platform funnel, the limitations become obvious. The standard workaround has been manual CSV exports into spreadsheets, which works for one team for one week and breaks for everyone else immediately after.
This guide walks through connecting Pinterest Ads to Data Studio (formerly Looker Studio, renamed by Google in April 2026) with Dataslayer, the three dashboards worth building for the 2026 Pinterest product mix (Performance+, the upgraded ad relevance model, and the Q1 2026 measurement updates), and the operational pitfalls that show up after the dashboards are live. The goal is to make Pinterest Ads measurable at the same depth as Meta or Google Ads.
Why Pinterest Ads needs an external dashboard in 2026
Three things changed in Pinterest's 2026 product mix that make external reporting more important than it used to be.
- Performance+ became the recommended default. Pinterest's official guidance positions Performance+ campaigns as the new default for most advertisers. Performance+ automates targeting, bidding, and creative decisions through Pinterest's AI optimization layer, similar in spirit to Meta Advantage+ and TikTok Smart+. The flip side: automation reports out as aggregate performance, and diagnosing what is working becomes harder without a structured external breakdown.
- The Q1 2026 measurement updates. PPC Land's coverage of the Q1 2026 updates documented a retrained ROAS model showing up to 11% gains in experimentation, a new A/B testing tool in Ads Manager, and direct integration of AI bidding with advertisers' own measurement sources of truth. The third point matters most: Pinterest's bidding now optimizes toward whatever outcome metric you define in your own system (customer lifetime value, profit per order, downstream pipeline) rather than only Pinterest-internal signals. That depth of integration only pays off if your dashboards reflect the same outcome metric.
- The ad relevance model overhaul. Pinterest's ad relevance update delivered 3x to 10x better candidate relevance and 2x more ad delivery for advertisers running on the platform. The increased delivery surface means more data is generated per campaign, and the relevance gains only translate to performance gains if the team can spot which creative formats and audiences are riding the relevance wave.
The common thread across all three: 2026 Pinterest produces more performance signal than 2025 Pinterest, but most of that signal stays trapped inside the native Pinterest Ads Manager view unless you pull it into a dashboard tool. The native view is sufficient for "is the campaign live and spending"; it is not sufficient for "which Performance+ configuration outperforms manual, and why."
What you can pull with Dataslayer's Pinterest connector
Before building dashboards, it helps to know exactly which Pinterest Ads data is available through the connector. Dataslayer's Pinterest connector exposes the full set of metrics and dimensions from the Pinterest Ads API, which covers more than the standard Ads Manager UI surfaces by default.
The metrics worth knowing about:
- Standard performance metrics. Spend, impressions, clicks, CTR, CPC, CPM, conversions, ROAS. These are the metrics any Pinterest report needs as a baseline.
- Pinterest-unique engagement metrics. Saves (exposed as "repins" in the Pinterest API and the connector), outbound clicks, and pin clicks. These are engagement signals specific to Pinterest's discovery-first format and are not directly comparable to a click or impression on Meta or Google. Treating them as distinct metrics rather than collapsing into "clicks" preserves the diagnostic value.
- Conversion-event tracking. Sign-ups, add-to-cart, checkouts, purchases, plus catalog and shopping ad performance at the product level. Critical for ecommerce reporting.
- Audience and demographic breakdowns. Age, gender, location, device type, interest categories. Pinterest's audience skews differently than Meta or TikTok, and these breakdowns surface the segment-level differences that matter for budget allocation.
- Account-structure dimensions. Campaigns, ad groups, individual ads. Standard three-level breakdown.
- Creative format and placement breakdowns. Creative format (standard pin, carousel, video, shopping ad) is exposed as an ad-level dimension called "Ad's pin creative type" in the connector, so format-level performance views are buildable in the same query. Placement (feed, related pins, search inventory) is exposed separately as a breakdown option. Both are available in the standard query interface without custom calculations.
What the connector covers that the native Ads Manager UI does not surface cleanly:
- Cross-campaign aggregation with custom date ranges (Pinterest's UI defaults to limited ranges).
- Pin-level performance over time, including saves and outbound clicks aggregated past the standard reporting window.
- Performance+ campaign metrics broken down by automation module state, which is where the diagnostic value lives for teams running multiple Performance+ configurations.
- Conversion-event data combined with creative and audience dimensions in a single query.
Connecting Pinterest Ads to Data Studio with Dataslayer
Before starting, just one thing to check: you need a Pinterest Business account (not personal) with Advertiser role on the ad account you want to report. If you have that, the rest is just a few clicks.
- Sign up at app.dataslayer.ai with your email to activate the 15-day free trial (no card required).
- Open a new or existing Data Studio report and click Add data to report. Search for "Dataslayer" in the connector gallery.
- Select the Pinterest Ads connector, connect your account when Pinterest asks, and pick which ad accounts to include.
- Click Connect and all Pinterest fields appear in Data Studio ready to drag onto your charts: spend, conversions, saves, outbound clicks, Checkout ROAS, and the bid strategy dimension to separate Performance+ from manual campaigns.
A note on the defaults: Dataslayer comes with Pinterest's conversion window (30-day click / 30-day view) and device breakdown set to match Pinterest Ads Manager, so the dashboard numbers reconcile with Ads Manager screenshots. You can change them if your team uses different values.
Connect Pinterest Ads to Data Studio with Dataslayer
Dataslayer's Pinterest connector pulls Performance+ campaign data, creative-level engagement, and Pinterest-unique metrics like saves and outbound clicks into Data Studio with unlimited rows on paid plans. Start the free trial and build the first dashboard today.
Try Dataslayer FreeDashboard 1: The Pinterest Performance+ control panel
The first dashboard most teams should build is a Performance+ control panel that makes the buying-layer automation visible. Performance+ does a lot of work for you, but it reports it as aggregate spend and conversion totals. The control panel surfaces the breakdown.
The views worth building into this dashboard:
- Top scorecards. Spend, conversions, Checkout ROAS, CPA, cost per conversion (depending on objective). These are the headline numbers the team checks first.
- Performance+ versus manual campaigns side-by-side. If the team runs both Performance+ and manual campaigns in parallel, the side-by-side comparison shows whether the automation is actually outperforming. Pinterest's own internal data cited >10% CPC and CPA improvements for Performance+ over manual; verifying this against your specific account is what informs the budget allocation decision. In Data Studio, the split is built using the bid strategy dimension with a calculated field that relabels automatic-bid campaigns as Performance+ for friendlier reporting.
- Campaign-level conversion trend over the rolling 30-day window. Performance+ campaigns can take several days to stabilize after launch. The 30-day rolling trend lets you spot whether a recently-launched Performance+ campaign is converging or whether it needs intervention.
- The "Performance+ outcome metric" trend. Now that Pinterest's bidding can optimize toward your own outcome metric, the dashboard should track that outcome metric directly. For configurations optimizing toward an outcome metric Pinterest tracks natively (Checkout ROAS, page-visit ROAS), the chart is buildable directly from the Pinterest connector. For external outcome metrics like LTV or profit per order, the chart is built by blending Pinterest conversions with your own outcome data through Dataslayer's Database connector in Data Studio.
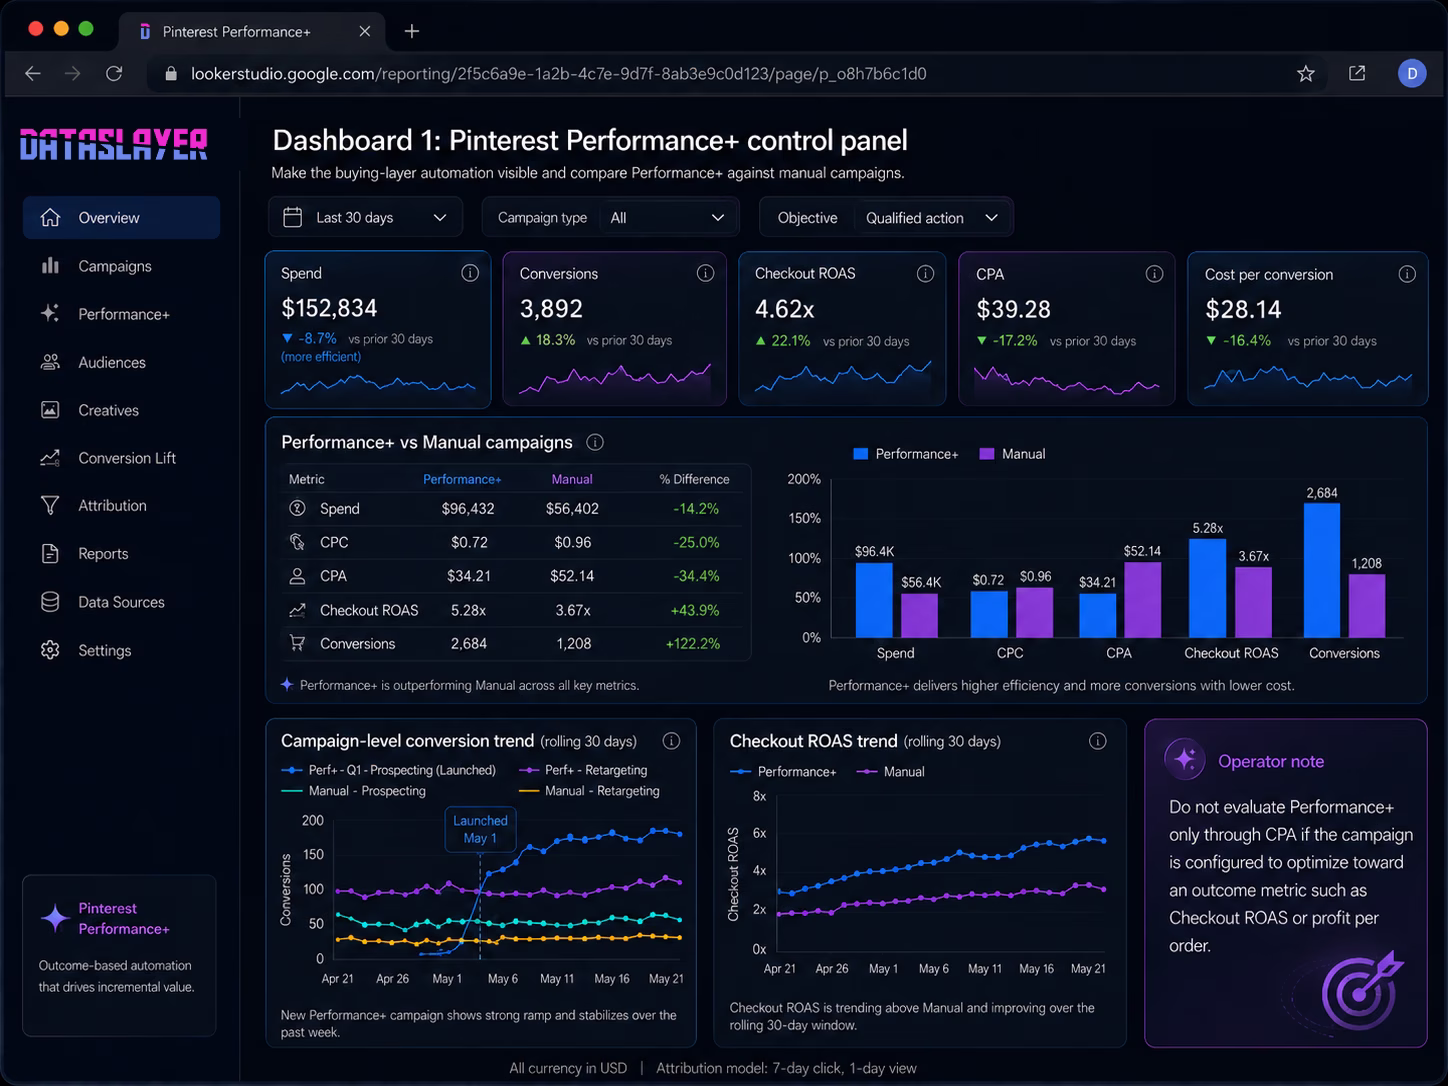
Operator-observed pattern: teams that build only the standard CPA and ROAS views miss the fact that Performance+ is optimizing toward something else if they configured it that way. The most common reporting mistake in the first 30 days of running Performance+ is reading the campaign as if it were still optimizing to CPA when the configuration was actually set to outcome-based bidding.
Dashboard 2: The creative and format breakdown
The second dashboard surfaces what is working at the creative and format level. Pinterest's ad relevance update means more creatives are reaching qualified audiences, but the relevance gains do not distribute evenly across creative formats. Knowing which formats are riding the relevance wave is the actionable signal.
The views to build:
- Creative format performance side-by-side. Standard pins, carousel, video, shopping ads. Engagement rate, conversion rate, ROAS broken down per format. The format that outperforms for your specific account is rarely the format Pinterest's general best-practice guidance recommends. Your account data overrides industry averages.
- Top 20 individual creatives. Ranked by ROAS or conversion volume, depending on objective. The top-20 view is where the next creative iteration cycle should start, because the patterns in the top performers are the patterns worth replicating.
- Saves and outbound clicks per creative. Saves (repins) are a Pinterest-unique signal that often predicts longer-term performance, since a saved pin can drive conversions weeks or months after the ad spend ends. The official guidance is documented in Pinterest's API analytics reference. Tracking saves alongside immediate-conversion metrics surfaces creatives that are undervalued by short-window measurement.
- Audience segment overlay. For top-performing creatives, the audience demographic breakdown shows whether the creative is winning broadly or only with a narrow segment. Narrow-segment winners are candidates for audience expansion.
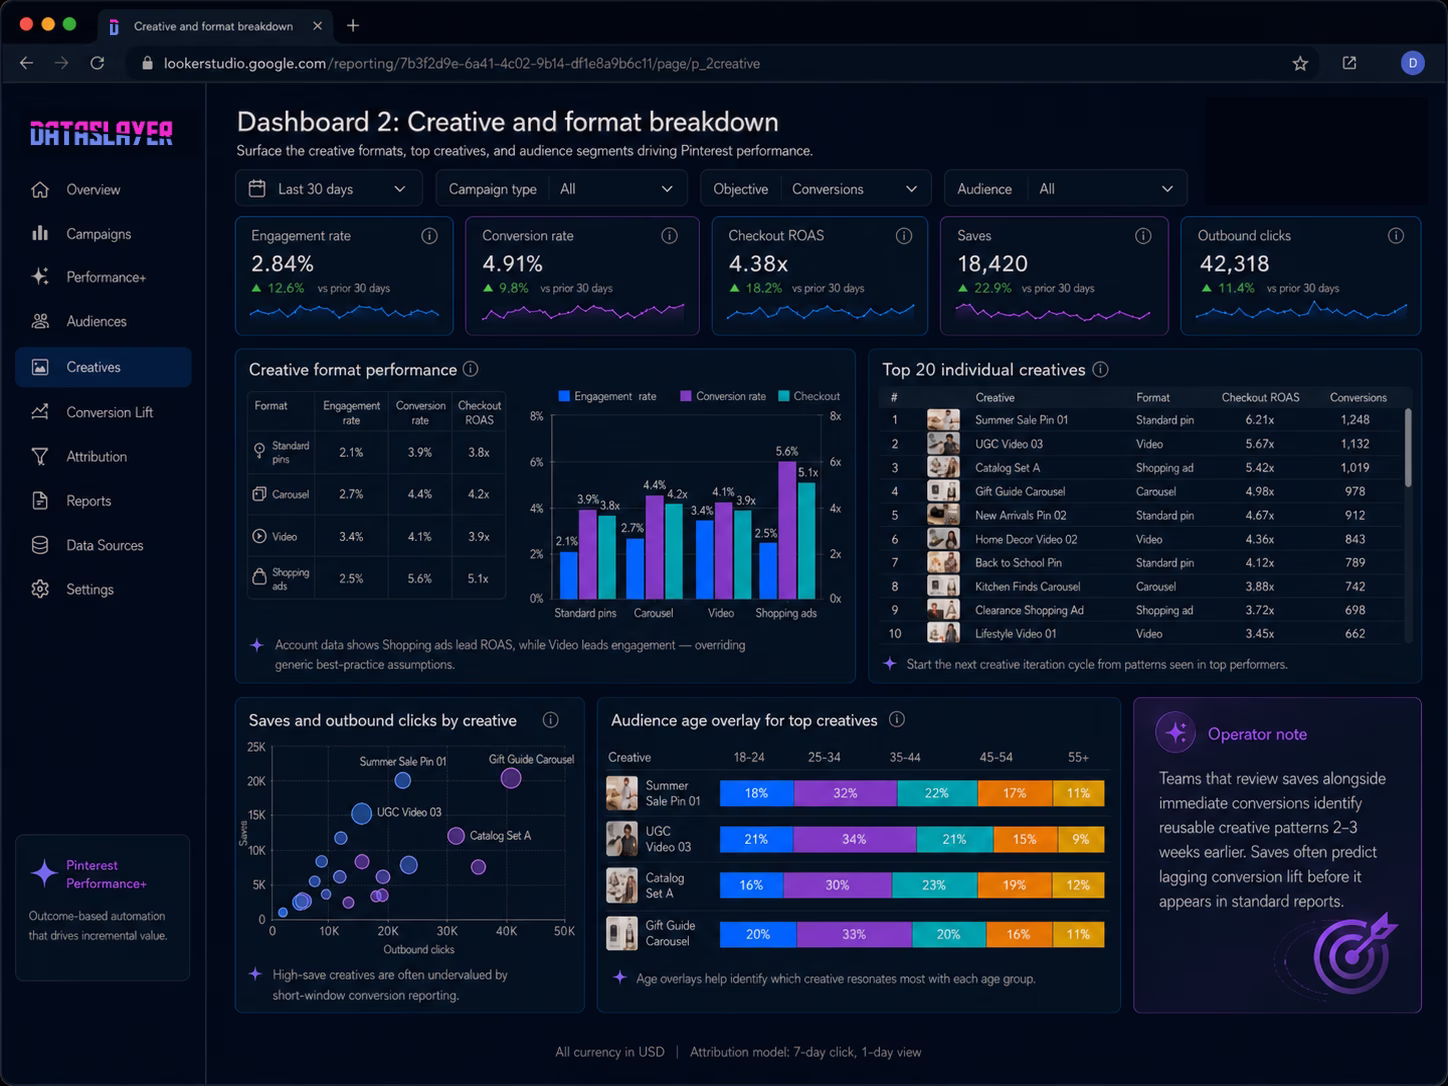
Operator-observed pattern: creative teams that include the saves metric in the standard performance review identify reusable creative patterns 2-3 weeks earlier than teams that only review immediate conversions, because saves predict the lagging conversion lift before it shows up in the standard report.
Dashboard 3: The cross-platform Pinterest comparison
The third dashboard is where Pinterest stops being a side-channel afterthought and becomes a comparable line item next to Meta, TikTok, and Google. The cross-platform view answers the budget allocation question: where should the next marginal dollar go?
The structure of the cross-platform view:
- Spend share by platform. What percentage of total paid social and paid search spend is going to Pinterest versus Meta versus TikTok versus other surfaces. This is the input view; it tells you how the budget is actually allocated.
- Conversion share by platform. What percentage of attributed conversions came from each platform. The delta between spend share and conversion share is where the budget rebalance signal lives. A platform contributing 8% of spend but 18% of conversions is undersaved.
- Cost per acquisition by platform. Direct CPA comparison, adjusted for the attribution model your team uses. Pinterest's CPA profile differs from Meta and TikTok because the conversion path is often longer (discovery → save → return purchase weeks later); the comparison should account for that path length rather than penalizing Pinterest for the lag.
- Brand search lift by platform. One of the most reliable indicators of paid social performance is the lift in branded search volume after a pulse. Tracking branded search alongside paid platform spend lets you spot which platforms are driving long-tail brand demand that does not appear in immediate-conversion reporting.
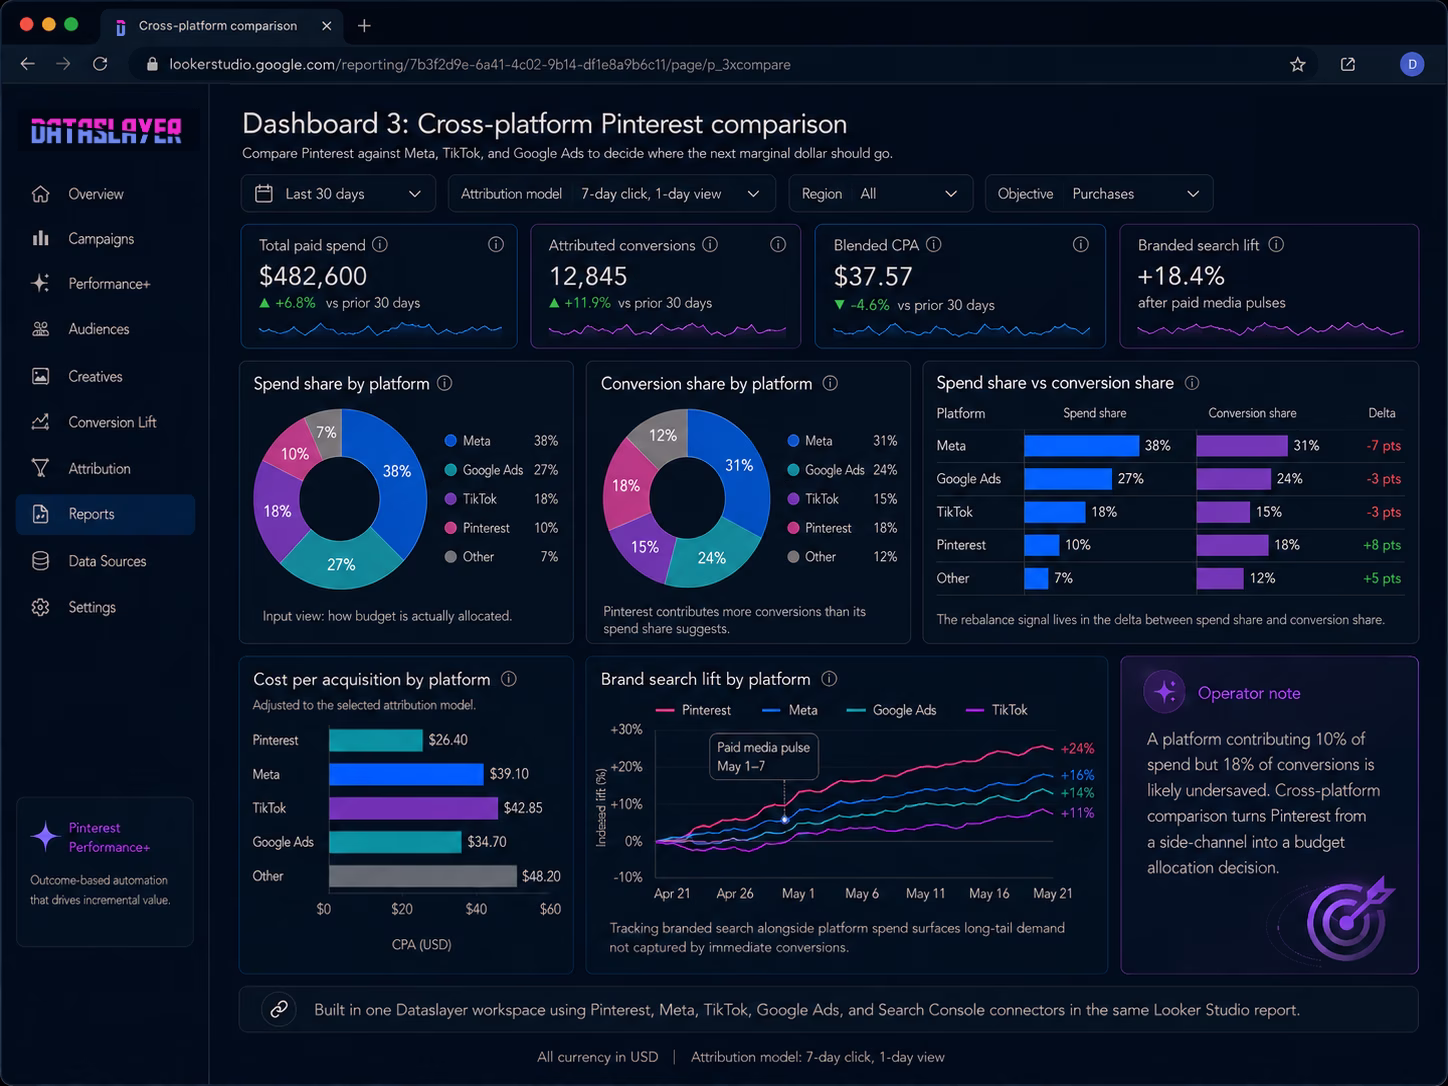
The cross-platform dashboard is buildable when you pull each paid platform's data through the same workspace. With Dataslayer, the Pinterest, Meta, TikTok, and Google Ads connectors all feed into the same Data Studio report, with unlimited rows on Data Studio across all paid plans.
Pinterest connector setup choices worth getting right
A handful of choices made at the connector level have an outsized effect on how the dashboards behave six months later. These are the ones to make deliberately at setup, not by default.
- The conversion window has to match Ads Manager. Dataslayer defaults to 30-day click / 30-day view to match Pinterest's Ads Manager view. If your team uses a different window when validating numbers against the native UI, set the connector to match. Mismatch here is the most common source of "the dashboard does not agree with the Pinterest screenshot I just took" tickets.
- Decide on the Saves versus Repins label early. Pinterest's API exposes saves under the legacy name "Repins" with paid, earned, and total variants. The consumer-facing Pinterest UI calls them Saves. Pick one label for your team and apply it as a calculated field at the data source level so the entire workbook uses consistent terminology. Switching mid-quarter creates documentation debt.
- Build the Performance+ relabeling once. The bid strategy dimension returns values like AUTOMATIC_BID and MANUAL_BID. A calculated field at the data source level that maps these to "Performance+" and "Manual" propagates to every chart automatically and avoids per-chart configuration work later. This is the underpinning of the Performance+ versus Manual diagnostic in Dashboard 1.
- Add the creative-type dimension to the schema. The field exposing standard pin, video, carousel, and shopping ad classifications is called "Ad's pin creative type" in the connector. Without it in the schema, every format-level chart needs its own calculated field. With it in the schema, the format breakdown is one drag-and-drop away.
- Filter awareness campaigns out of CPA scorecards. Pinterest's campaign objective type dimension separates awareness from consideration from conversion campaigns. Awareness campaigns are not optimizing for CPA, so including them in a CPA average pulls the number toward an artifact. The cleanest pattern is a page-level filter that scopes CPA scorecards to conversion-objective campaigns only.
- Daily refresh is the practical sweet spot. Pinterest's reporting API stabilizes conversion data within 2-4 hours of an event, with full settlement at the 30-day mark for delayed attribution. Hourly refreshes do not produce materially fresher numbers and burn API quota for no diagnostic gain. Daily refresh at a consistent time strikes the right balance.
Common pitfalls when reporting Pinterest Ads externally
These are the operational details that trip teams up after the dashboards are live.
- Treating saves as a conversion metric. Saves (repins) are a Pinterest-unique engagement signal, not a conversion. Counting them in the same column as purchases inflates apparent performance. Track them as a leading indicator in a separate column.
- Comparing Pinterest CPM directly to Meta CPM. The CPM profiles are different because the audience and the inventory dynamics are different. Pinterest is typically lower CPM but with longer conversion paths. A side-by-side CPM table without that context is misleading.
- Underestimating the Performance+ stabilization window. Performance+ campaigns can take 7-14 days to converge after launch. Reading performance at day 3 and pulling the campaign because CPA looks high is a common mistake. Set the report window to start at day 8 minimum for newly-launched Performance+ campaigns.
- Ignoring the catalog and shopping ads breakdown. For ecommerce accounts, shopping ads often perform very differently from standard promoted pins. Bundling them in the same report bucket buries the diagnostic signal. Split shopping ad performance into its own view.
- Missing the attribution-window mismatch. Pinterest's default attribution windows differ from Meta and Google. When building cross-platform comparison views, align the attribution windows or annotate the difference clearly. Otherwise the comparison is not apples-to-apples.
- Not tracking Performance+ configuration changes. Each Performance+ campaign has a configuration state (which automation modules are on, what outcome metric is the target). When the team changes the configuration, performance shifts. A change log that timestamps configuration changes against the performance trend prevents the "why did CPA spike on May 12" mystery.
FAQ
Can I connect Pinterest Ads to Data Studio without using Dataslayer?
Yes. Pinterest doesn't publish a first-party connector, but several third-party connectors are available in the Looker Studio gallery (Supermetrics, Windsor.ai, Funnel, Porter Metrics, Coupler, Catchr, among others). Trade-offs vary by vendor: row limits on free tiers, which dimensions are exposed, and whether cross-platform blending is supported. Teams reporting Pinterest in isolation can pick the cheapest option that exposes the dimensions they need; teams that need cross-platform blending and unlimited rows on paid Data Studio plans typically prefer Dataslayer.
How fresh is Pinterest Ads data through Dataslayer?
Refresh cadence is configurable. Most teams set hourly or daily refreshes depending on the reporting use case. Pinterest's API itself has reporting latency in the 2-4 hour range for new conversion events, which is the floor regardless of the connector you use.
Does Dataslayer support Pinterest Performance+ campaign reporting?
Yes. Performance+ campaigns appear in the standard campaign-level reporting with their configuration metadata available as dimensions. The diagnostic breakdowns covered in this article (Performance+ vs manual via bid strategy, stabilization-window analysis) are buildable in the standard query interface. Outcome-metric tracking such as LTV per conversion requires blending Pinterest conversion data with your own outcome data via Dataslayer's Database connector in Data Studio, since LTV lives in your CRM rather than the Pinterest API.
What is the cost of using Dataslayer to connect Pinterest Ads to Data Studio?
The Pinterest connector is included in every Dataslayer plan, including the free trial. There are no per-connector fees. Pricing is based on usage (API calls, rows processed, accounts connected) and you can combine Pinterest with other platforms like Meta Ads, Google Ads, and TikTok Ads under the same plan.
Can I pull historical Pinterest Ads data, or only forward from connection date?
You can pull historical data subject to Pinterest's API retention policy, which currently allows access to roughly 90 days of historical performance data per query. For longer-term historical reporting, the standard pattern is to write Pinterest data to BigQuery or another data warehouse continuously so the historical store builds up independently of Pinterest's API window.
How do I report on saves and outbound clicks alongside standard ad metrics?
Both are standard fields exposed by the Pinterest connector. Saves are labeled as "repins" in the Pinterest API (paid, earned, total variants); outbound clicks are exposed as paid, earned, and total variants too. Add them as additional metrics in your query and visualize them as separate columns or charts. Treat them as Pinterest-unique engagement metrics, not as substitutes for conversions or clicks.
Conclusion
Pinterest Ads in 2026 generates more performance signal than the previous product generation, between Performance+ automation, the Q1 2026 ROAS model upgrade, and the ad relevance overhaul that delivered 3x to 10x better candidate relevance. That signal stays trapped in the native Pinterest Ads Manager view unless the team builds an external dashboard. The three dashboards covered in this article (Performance+ control panel, creative and format breakdown, cross-platform comparison) make Pinterest measurable at the same depth as the larger paid social and paid search channels, and the setup runs in a handful of steps from initial Dataslayer signup to the first live report.
The honest framing for marketing teams that have historically treated Pinterest as a side channel: the 2026 product improvements have raised Pinterest's performance ceiling enough that the side-channel treatment is no longer defensible. Whether that means rebalancing budget toward Pinterest depends entirely on what the cross-platform dashboard shows for your specific account, which is exactly what this guide is designed to make visible.
Start a free Dataslayer trial to connect Pinterest Ads, Meta Ads, TikTok Ads, Google Ads, and 50+ other marketing sources into Data Studio, with unlimited rows on Data Studio across all paid plans. For teams already running automated AI campaigns on TikTok, our companion guide on TikTok Smart+ vs Symphony covers the equivalent measurement architecture for the TikTok AI stack. And for Meta-side reporting, our guide on Meta Ads to Looker Studio walks through the dashboard pattern for the largest paid social surface.


