

Marketing analytics in 2026 won't look like 2024. AI agents will make optimization decisions without you. Your data stack will be assembled from multiple tools instead of one platform. Real-time activation becomes expected, not impressive. According to ChiefMartec's 2024 survey, marketing teams added an average of 3 new platforms in 2024. At this rate, you'll manage 20+ platforms by 2026. This guide covers five trends reshaping how marketers collect, analyze, and act on data and what to do about it now.
The State of Marketing Analytics Right Now
Most marketing teams use 10-15 different platforms. Google Ads for search. Meta for social. LinkedIn for B2B. TikTok for awareness. Google Analytics for website data. Shopify for e-commerce. HubSpot for CRM.
Each platform has its own dashboard, its own metrics, its own date formats. Google Ads shows MM-DD-YYYY. Facebook uses DD-MM-YYYY. LinkedIn exports include columns the others don't.
The result: analysts spend 10-15 hours weekly just pulling reports and making the data match. Not analyzing. Not optimizing. Just getting numbers into the same spreadsheet.
This doesn't scale. The average marketing team added 3 new platforms in 2024 according to ChiefMartec's annual survey. At this rate, you'll be managing 20+ platforms by 2026.
The next wave of marketing analytics is about intelligent systems that act on data, infrastructure that adapts instead of forcing rigid templates, and measurement that works when you can't track individuals.
Trend #1: AI Agents Execute Optimizations Autonomously
What's Actually Changing
Right now, AI analyzes your data and tells you what to do. You ask ChatGPT to review your Google Ads performance, it suggests changes, you implement them manually.
By mid-2026, AI agents will detect the issue, test solutions, and implement changes without asking permission first.
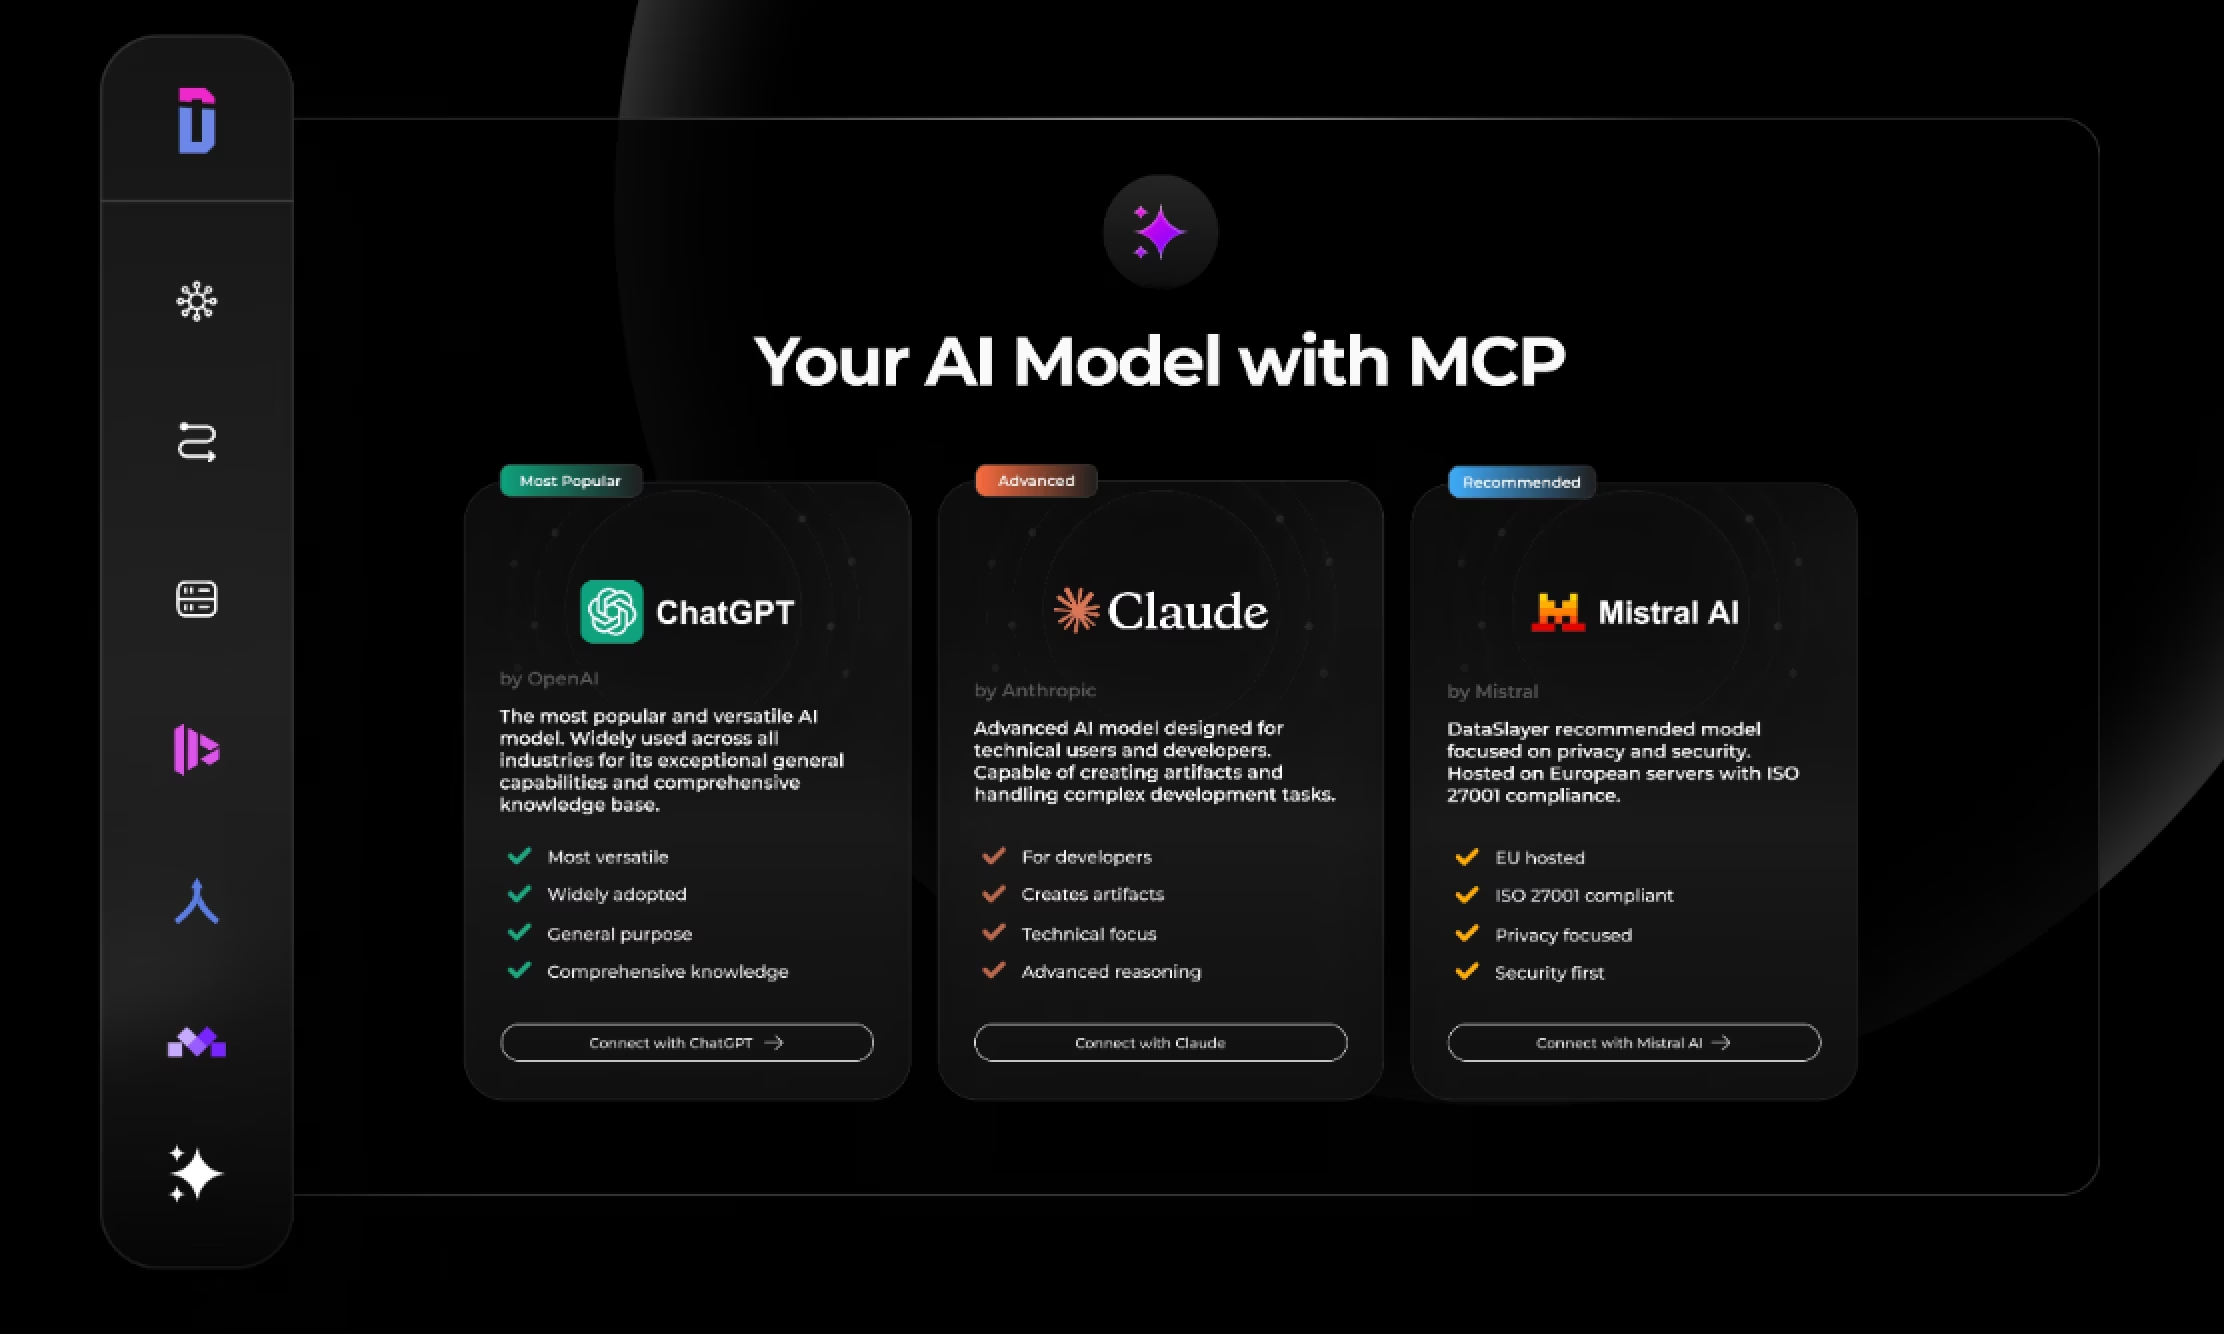
The infrastructure exists now. Anthropic's Model Context Protocol lets AI connect directly to your marketing platforms. OpenAI's function calling does the same. Google's Gemini API supports multi-step workflows.
An AI agent might:
- Notice your Google Ads CPC increasing 15% week-over-week
- Automatically test 3 new ad variations
- Shift budget to the winning creative
- Send you a summary: "CPC was climbing, tested new ads, winning variant reduced CPC to $2.10, saved $340 this week"
You didn't ask it to do this. It saw the problem and fixed it.
Real Example
Turkish home goods retailer Karaca implemented AI-driven automation through Google's Shopping campaigns in 2024. The system handled budget allocation, bidding strategies, and product-level optimization decisions that previously required manual oversight.
Result: 44% ROAS increase and 31% revenue growth from May 2024 to February 2025. The AI managed decisions across a 2,000+ product catalog, making adjustments that would have required hours of daily manual work.
How to Prepare
Start with read-only agents. Set up AI that recommends actions but needs approval before executing anything. You'll learn what the AI sees in your data and whether you trust its judgment.
Write down your current decision rules. When do you pause an ad? When do you increase budget? What CPA is too high? These rules become instructions for your agent.
Tools that work today: ChatGPT with the Dataslayer MCP integration connects AI directly to your marketing platforms. Claude with function calling does the same. You're not waiting for 2026. This works now.
Trend #2: Composable Data Stacks Replace All-in-One Platforms
What's Changing
All-in-one marketing platforms force you into their ecosystem. Buy Salesforce Marketing Cloud and you use their email tool (even if it's mediocre), their analytics (even if it's limited), their automation (even if it's clunky).
Composable stacks flip this. You connect best-of-breed tools through APIs and data pipelines. Use Klaviyo for email because their segmentation is better. Analyze in BigQuery because SQL gives you more control. Build dashboards in Looker Studio because it's free and flexible.
Each tool does one thing well instead of everything poorly.
This shift is happening because:
- Marketing platforms now have comprehensive APIs
- Data warehouses (BigQuery, Snowflake) got affordable for mid-market companies
- Integration tools (Fivetran, Airbyte) solved the "plumbing" problem
A 2024 survey found that 90% of companies have integrated some form of MACH architecture (Microservices, API-first, Cloud-native, Headless) into their operations, signaling composable approaches as the default for future-ready platforms.
Real Example
UK flower delivery network Interflora implemented composable commerce architecture and achieved measurable results: improved website performance, better SEO results, increased sales, and 20% reduction in annual hosting costs. The modular approach let them swap components without rebuilding their entire system.
Danish sports retailer SPORT 24 adopted a best-of-breed technology stack for flexibility in creating promotions and scalability during traffic spikes. Preliminary A/B tests showed 14% increase in order conversion and 13% increase in average order value.
How to Prepare
Map your current data flow. Where does data originate (ad platforms, website, email)? Where does it go (spreadsheets, dashboards, CRM)? What manual steps exist between?
Identify the biggest pain point. Manual data export eating 10 hours weekly? Reporting tool that can't answer your questions? Need data in places your platform doesn't support?
Start with one destination. Don't rebuild everything at once. Pick BigQuery if you use Google Workspace, Snowflake if you don't. Get one data source flowing automatically. Prove it works. Then expand.
Budget $500-2,000/month for infrastructure depending on data volume. Usually costs less than all-in-one platforms while providing more capability.
Trend #3: Real-Time Activation Becomes Expected
What's Changing
Marketing analytics is shifting from "what happened last month" to "what's happening now and what should we do."
Real-time activation means data triggers actions immediately. Customer abandons cart, email sends in 10 minutes. High-value prospect visits pricing, sales alert fires instantly. Competitor launches promotion, your PPC bids adjust automatically.
The gap between data collection and action is collapsing from days to minutes.
Hypothetical Example
Consider a financial services company implementing real-time audience activation. When users visit specific content (retirement calculators, investment guides), a well-designed system could:
- Add them to Google Ads retargeting within 15 minutes
- Update their CRM profile with content interests
- Trigger personalized email based on which calculator they used
- Adjust LinkedIn ads to show relevant case studies
Old process: Weekly audience exports, manual CSV uploads, 7-14 day lag between user action and retargeting
New process: User visits content, appears in retargeting audience in 15 minutes, sees relevant ads that evening
Companies implementing similar real-time approaches typically see 15-20% improvements in cost-per-acquisition because ads reach prospects while interest is fresh, not weeks later after they've moved on.
How to Prepare
Implement event streaming. Tools like Segment, RudderStack, or Google Tag Manager server-side can capture actions and route them in real-time instead of daily batch exports.
If using a data warehouse, set up reverse ETL. Census, Hightouch, or Polytomic sync audiences from your warehouse back to ad platforms continuously. A user qualifying for a high-intent segment at 2pm appears in your Facebook audience by 2:15pm.
Build trigger-based workflows. Identify 3-5 critical moments (demo request, pricing page visit, abandoned cart) and automate the response.
Real-time doesn't always mean instant. Sometimes "within the hour" is fast enough. Determine acceptable delays for each use case.
Trend #4: Privacy-First Measurement Becomes Mandatory
What's Changing
Third-party cookies are dead. Apple's App Tracking Transparency killed mobile attribution. iOS tracking opt-in rates sit below 25% according to Flurry Analytics. Privacy regulations keep tightening globally.
Marketing measurement in 2026 depends on aggregate signals and modeled data, not individual-level tracking.
The measurement approaches that work:
Marketing Mix Modeling (MMM): Statistical analysis of historical data to understand channel contribution without tracking individuals. Netflix and Procter & Gamble have publicly discussed returning to MMM.
Conversion modeling: Platforms use machine learning to estimate conversions they can't measure directly. Google's Enhanced Conversions and Meta's Conversions API both fill attribution gaps with probabilistic models.
First-party data: Email lists, loyalty programs, authenticated website experiences where you control measurement directly.
Clean rooms: Secure environments where you analyze combined datasets without exposing individual user data. Google Ads Data Hub, Amazon Marketing Cloud, and options like Habu provide clean room analysis.
Real Example
CPG brands are leading the return to Marketing Mix Modeling. A Nielsen study analyzing 10 CPG brands in Southeast Asia using MMM found that aggregate statistical modeling could measure channel effectiveness without individual tracking, yielding $1.70 return for every advertising dollar in the measured channels.
Another retailer using MMM analyzed data across TV, online, and in-store promotions and discovered digital advertising had higher ROI than traditional TV ads. This insight led to strategic budget reallocation, increasing sales by 15%.
A leading CPG company implementing MMM for promotional campaigns found certain discount offers generated significantly higher sales during specific times. By aligning their promotional calendar with these insights, they achieved a 10% increase in annual sales.
How to Prepare
Implement server-side tracking. Google Tag Manager server-side container, Facebook Conversions API, or Google Enhanced Conversions improve data quality in privacy-restricted environments.
Build first-party data collection. Gated content, email signups, loyalty programs create measurement opportunities that don't depend on third-party cookies.
Test incrementality measurement. Run geo-holdout tests to validate what's actually driving results. Most platforms (Google, Meta, TikTok) offer built-in incrementality testing now.
Expect less precision, demand more accuracy. You won't know which ad convinced which person. You will know which channels drive incremental growth.
Trend #5: Retail Media Consolidates Around Major Players
What's Changing
Retail media networks (Amazon Ads, Walmart Connect, Target's Roundel) became the fastest-growing ad channel in 2024. But small and mid-sized retailers who launched ad programs are discovering it's expensive and complex to operate an advertising platform.
By 2026, retail media consolidates around 5-7 major players while hundreds of smaller programs shut down.
Early signs: smaller retail media networks struggle with limited scale (not enough traffic), poor targeting (minimal customer data), and weak measurement (basic attribution). Advertisers testing these platforms find CPMs competitive but conversion rates lag significantly behind Amazon or Walmart.
What This Means
Buying and measuring retail media gets simultaneously easier and more complex.
Easier: fewer platforms to manage. Running Amazon, Walmart, Target, and Instacart covers 80%+ of viable retail media.
More complex: each network uses proprietary reporting formats, attribution windows, and measurement methodologies. Normalizing performance data across platforms remains difficult.
Hypothetical Example
Consider a beverage brand testing retail media across 12 retailer platforms:
Amazon Ads: Strong performance with clear attribution to purchasesWalmart Connect: Solid performance with reliable reporting
Regional grocery chains: Lower CPCs but significantly worse conversion rates and attribution difficulties
Brands testing broadly often consolidate 80-85% of retail media budget into the top 3-4 networks after discovering smaller platforms aren't worth the management overhead for marginal additional reach.
How to Prepare
Focus testing on top-tier networks first. Amazon Ads, Walmart Connect, Target Roundel, Instacart, and Kroger have scale and infrastructure for reliable performance. Test smaller networks only after optimizing these.
Build retail media into attribution modeling. Retail media conversions often get credited to other channels because customers saw a social ad, searched, then clicked retail media. Understand how channels interact rather than evaluating each in isolation.
Prepare for walled gardens. Each major retail media network is its own ecosystem with limited data sharing. You'll need to aggregate performance from multiple platforms into consolidated reporting.
Predictions: What We'll See in H2 2026
Marketing analytics roles split into two tracks: technical operators who build data infrastructure, and strategic analysts who interpret data. The generalist who does everything becomes harder to sustain.
Platform consolidation accelerates. Expect major acquisitions as larger martech companies buy composable infrastructure players. Data warehouse providers will acquire transformation tools. Analytics platforms will buy activation capabilities.
AI agent marketplaces emerge. Instead of building custom agents, marketers browse libraries: "Google Ads budget optimizer," "competitor monitoring agent," "content performance analyzer." Pre-built agents work like app stores.
Privacy-first measurement becomes regulated, not optional. US federal privacy legislation in 2025-2026 will explicitly address marketing measurement, accelerating the shift toward aggregate measurement.
Real-time becomes actually real-time. Current "real-time" activation often means 15-60 minute delays. By H2 2026, expect sub-5-minute activation for high-priority use cases.
The "analytics engineer" role becomes mainstream in marketing. Organizations create dedicated roles for building and maintaining data infrastructure rather than analyzing campaign performance.
FAQ
What's the single most important change to prepare for?
Shift toward composable data infrastructure. Your ability to collect, connect, and activate data determines what's possible everywhere else. AI agents need data infrastructure. Real-time activation requires data pipelines. Privacy-first measurement depends on first-party data collection.
Start by centralizing your data: data warehouse, well-structured spreadsheet system, or customer data platform. Once data is accessible, everything else gets easier.
Budget 3-6 months for foundational infrastructure if starting from scratch. Most teams underestimate time required for data quality cleanup and establishing naming conventions.
Will AI agents replace marketing analysts?
No, but AI changes what analysts do. Spreadsheets didn't eliminate financial analysts. They eliminated manual calculation and elevated analysts to focus on interpretation.
Marketing analysts in 2026 spend less time pulling reports and normalizing data. AI handles that. They spend more time defining what questions matter, interpreting patterns, and making strategic decisions.
Analysts who struggle are those whose value comes entirely from data access and report generation. Analysts who thrive understand business context, ask better questions, and translate insights into strategy.
How much should mid-market companies budget for analytics infrastructure?
For $5-20M revenue companies, expect $1,500-3,000/month covering:
- Data warehouse ($300-800/month)
- Data integration tools ($400-1,200/month)
- Transformation layer like dbt ($100-300/month)
- Visualization/reporting ($200-500/month)
- AI agent capabilities ($200-400/month)
Advanced capabilities add $1,000-2,500/month: real-time activation, marketing mix modeling, additional data sources.
Compare this to continuing with fragmented data and manual reporting. Most mid-market companies waste 20-30 hours weekly on data tasks that infrastructure automates. Calculate your team's hourly cost. Infrastructure usually pays for itself in 60-90 days.
What's the biggest mistake implementing new analytics technology?
Starting with tools instead of processes. Companies buy a data warehouse, set up connectors, and wonder why nothing improved.
Document your current workflow first:
- What decisions do you make weekly/monthly?
- What data do you need for those decisions?
- Where does that data live?
- How long does collecting and analyzing it take?
- What questions can't you answer now?
Then evaluate which technology addresses specific gaps. A team needing better attribution has different requirements than one needing faster reporting.
Best infrastructure investment eliminates a specific, documented pain point. Worst is implementing something because it seems like the future without knowing what problem it solves.
How does privacy-first measurement work without tracking individuals?
Privacy-first measurement uses aggregate data and statistical modeling instead of tracking individual journeys.
Marketing Mix Modeling: Uses historical data to understand channel relationships. Statistical models estimate each channel's incremental impact by analyzing correlations between spend and conversions across all channels and time periods.
Geo-holdout testing: Run campaigns in some markets but not others, measure sales differences. If markets with advertising see 15% higher sales, you've proven incremental impact without tracking individuals.
Conversion modeling: Platforms use machine learning to estimate unmeasured conversions based on patterns in measurable data. If tracked users with demographic X and behavior Y convert at 8%, the platform assumes similar untracked users convert at around 8%.
These approaches sacrifice precision for privacy compliance. You won't know exactly which touchpoints influenced which customers. You will know which channels drive incremental growth. For most strategic decisions, aggregate insights are sufficient.
Should small businesses invest in advanced analytics infrastructure?
Generally no, not yet. Most small businesses don't have data volume to benefit from advanced infrastructure.
Small business priorities:
- Track basic metrics correctly: revenue, CAC, LTV, channel performance
- Use platform-native reporting: Google Ads dashboard, Facebook Ads Manager provide enough insight for 2-5 channels
- Manual consolidation is acceptable: a spreadsheet logging weekly metrics works fine under $500K revenue
- Invest when consolidation becomes painful: if you're spending 10+ hours weekly pulling reports or managing 8+ channels, infrastructure becomes worthwhile
The threshold varies by complexity. E-commerce with 3 ad platforms, email, and website might need infrastructure at $300K revenue. Service business with only Google Ads might not need it until $2M.
Don't let infrastructure become procrastination. Best analytics setup is the one you actually use to make decisions.
What happens to marketers who don't adapt?
They spend increasing time on manual work that competitors automated, creating compounding disadvantage.
Two e-commerce companies, both $5M revenue:
Company A (adapts): Implements composable stack Q1 2025. Marketing analyst spends 5 hours weekly on reporting, 15 hours on analysis. By Q4 2025, they've tested 40 audience segments, identified 3 most profitable customer types, optimized spend accordingly.
Company B (doesn't adapt): Continues manual reporting. Analyst spends 15 hours weekly pulling data, 5 hours on analysis. By Q4 2025, they've tested 12 segments because data access is the bottleneck.
The gap compounds. Company A's infrastructure enables faster testing, producing more learnings, improving decisions, growing revenue, funding better infrastructure. Company B falls further behind each quarter.
By late 2026, Company A is likely 25-40% more efficient because they've accumulated 18 months of additional testing cycles.
Risk isn't dramatic failure. It's gradual irrelevance. Your campaigns keep running. Business keeps operating. You just slowly lose ground to competitors making better decisions faster.
What to Do Next
Start with one foundational change in Q1 2025.
Choose the infrastructure piece addressing your biggest pain point. If manual reporting consumes 10+ hours weekly, centralize data first. If delayed decisions hurt performance, implement real-time activation. If attribution is broken, test privacy-first measurement.
Don't attempt everything simultaneously. Marketing analytics transformation takes 12-18 months done properly. Companies rushing implementation end up with expensive infrastructure they don't use effectively.
Build internal knowledge before buying tools. Read documentation. Watch tutorials. Understand what problems the technology solves. Difference between successful and failed infrastructure projects usually comes down to whether the team understood what they were building before starting.
Marketers who thrive in 2026 won't have the most sophisticated technology. They'll have identified specific problems technology could solve, implemented targeted solutions, and actually used infrastructure to make better decisions faster.
The future of marketing analytics isn't about having the newest tools. It's about building systems that turn data into decisions without manual bottlenecks.


