

Marketing analytics reporting combines data analysis with clear communication to make better decisions about campaigns and budgets. It's not just pulling numbers from Google Ads or creating dashboards, it's finding patterns in your data and presenting them in ways that change what your team does next.
The problem most teams face: they either analyze data that never gets shared, or they create reports full of metrics that nobody acts on. Effective marketing analytics reporting requires both deep analysis of what's happening and clear communication of what it means.
This guide covers how to build a marketing analytics reporting system that people actually use, from data collection to creating reports that drive action.
What Marketing Analytics Reporting Actually Is
Think of it as two connected activities:
- Analytics = Finding the story. Why did conversions drop 15% last week? Which audience segments convert best? What's the real cost per customer across all channels?
- Reporting = Telling that story. Your CEO needs to know if paid social is profitable. Your PPC manager needs today's budget pacing. Your content team needs to know which topics drive leads.
You need both. Analysis without reporting means insights die in spreadsheets. Reporting without analysis means dashboards full of numbers that don't mean anything.
The 5 Components of Marketing Analytics Reporting
1. Data Collection and Integration
Your data lives in different places with different formats:
- Google Ads shows dates as YYYY-MM-DD
- Facebook Ads uses MM/DD/YYYY
- Your CRM might use DD-MM-YYYY
Most marketing teams manually export data from multiple platforms every week. This creates outdated data, manual errors, and wasted time.
Three approaches to fix this:
- Manual exports: Download CSVs, combine in spreadsheets. Only works with 1-2 sources.
- API connections: Write code to pull data automatically. Requires developers but gives complete control. Google's API documentation provides detailed implementation guides for major platforms.
- Integration tools: Pre-built connectors that automate data pulls. You can use tools like Dataslayer if pulling from multiple sources, it connects 50+ platforms to Google Sheets, Looker Studio, and BigQuery without code.
2. Data Processing
Raw data is messy. Common problems:
Google Ads exports dates as YYYY-MM-DD. Facebook uses MM/DD/YYYY. If you don't standardize, your time-series analysis breaks.
Different team members name campaigns differently. Is it "FB Ads," "Facebook Advertising," or "Meta Ads"? Inconsistent naming makes aggregation impossible.
What counts as a conversion? Google Analytics tracks every form submission. Your CRM only counts sales-qualified leads. Your payment processor shows purchases. Pick one definition and stick to it. Google's measurement protocol documentation explains how different platforms track conversions differently.
3. Analytics
This is where you find what matters:
Attribution analysis: A customer clicked your Facebook ad Monday, searched your brand Wednesday, clicked a Google Ad Thursday, purchased Friday. Which channel gets credit? Most conversions involve multiple marketing touchpoints, so single-channel reporting drastically undercounts effectiveness.
Cohort analysis: Customers from organic search might have higher lifetime value than paid social customers. That changes your acceptable acquisition cost.
Anomaly detection: Your cost per click doubled yesterday. Is it a bidding algorithm change, a competitor, or a tracking error? Catch these before they drain your budget.
4. Report Creation
Build different reports for different people:
Executive reports: Revenue by channel, customer acquisition trends, efficiency ratios. One page. Monthly updates. Scannable in five minutes.
Campaign reports: Cost per conversion by campaign, audience performance, budget pacing. Daily or weekly updates for active campaigns.
Channel-specific reports: Your paid search specialist needs quality scores and bid adjustments. Your email marketer needs deliverability and segment engagement. Don't give everyone the same report.
Marketers make better decisions with 5-7 key metrics displayed prominently than with 20+ metrics competing for attention.
5. Action Process
Reports are useless without follow-up.
Set decision triggers: If cost per lead exceeds $75, pause the campaign. If ROAS hits 4x, increase budget 20%.
Schedule regular reviews: Weekly for active campaigns. Monthly for strategy. Quarterly for planning.
Document changes: Note what you changed, why, and what happened. Three months later you'll know if it worked.
4 Report Types You Actually Need
Performance Reports
Track current metrics against goals:
- Spend vs budget
- Conversions and trends
- Cost efficiency (CPC, CPL, CAC)
Update daily for paid campaigns, weekly for organic channels.
Attribution Reports
Show how touchpoints contribute to conversions.
First-touch: Credits the first interaction. Shows awareness drivers.
Last-touch: Credits the final interaction. Shows what closes deals but ignores the journey.
Linear: Spreads credit equally. Simple but usually inaccurate.
Time-decay: More credit to recent touchpoints. Better reflects reality.
Data-driven: Uses machine learning. Most accurate but needs significant data. Google Analytics 4's attribution documentation explains how different attribution models work and when to use each.
Customer Behavior Reports
Focus on how different segments perform:
- Acquisition channel
- Lifetime value
- Engagement level
- Geographic location
Typical finding: organic search delivers fewer leads than paid search but higher lifetime value. That completely changes your ROI calculation.
ROI Reports
Calculate true return across channels.
Customer Acquisition Cost (CAC): Total marketing spend ÷ new customers. Calculate by channel and segment.
Return on Ad Spend (ROAS): Revenue ÷ ad spend. Most businesses need 3:1 or higher to be profitable.
Marketing Efficiency Ratio: Total revenue ÷ total marketing spend. Captures the big picture.
Payback period: How long until customer revenue covers acquisition cost. Critical for cash flow.
How to Build Your Reporting System
Step 1: Define KPIs
Start with business goals, not metrics.
Bad: "Track Instagram engagement"
Good: "Generate 50 qualified leads per month from social"
For each goal, identify metrics that show progress:
- Goal: Increase qualified leads
- Primary KPI: Marketing-qualified leads per month
- Secondary: Cost per MQL, MQL to SQL conversion rate
Avoid vanity metrics. Total followers and page views don't indicate revenue impact. HubSpot's KPI guide provides frameworks for choosing metrics that actually matter.
Step 2: Automate Data Collection
Stop manual exports.
Small teams (1-5 people): Google Sheets with automated data imports.
Mid-size teams (5-20): Business intelligence tools like Looker Studio with automated pipelines.
Large teams (20+): Data warehouses (BigQuery, Snowflake) with ETL pipelines. Requires dedicated analytics engineering.
Step 3: Create Analysis Workflows
Document your process:
Daily reviews: Check active campaigns for anomalies. 15-30 minutes.
Weekly analysis: Deeper dive into trends. Compare week-over-week. 1-2 hours.
Monthly reporting: Complete review across channels. Update stakeholders. 3-4 hours.
Quarterly planning: Comprehensive analysis for budget allocation. Full day.
Build templates so you're not starting from scratch.
Step 4: Design Dashboards
Real-time operations: Live data for campaign managers. Current spend, conversions today, budget pacing.
Executive summaries: High-level metrics. Revenue impact, growth trends, efficiency ratios. One page, mostly visualizations.
Channel-specific: Detailed metrics for specialists. Paid search dashboards include quality scores. Email dashboards show deliverability and automation performance.
Keep it simple. Five key metrics work better than twenty.
Step 5: Build Action Processes
Set thresholds that trigger decisions automatically.
Schedule recurring meetings tied to reporting cadence.
Track what you changed and why. Document every optimization.
Close the feedback loop. Measure results and update your decision rules.
5 Mistakes That Kill Marketing Reports
1. Reporting Without Analysis
Problem: Dashboards full of numbers with no interpretation.
Fix: Add a summary to every report. Include key findings, notable changes, likely causes, and recommended actions. Put this first, not at the end.
2. Analytics Without Context
Problem: "Our cost per click is $2.37" with no indication if that's good or bad.
Fix: Always show comparison points. Current vs previous period, vs same period last year, vs target, vs industry benchmarks. Context turns data into information.
3. Over-Complicated Reports
Problem: 30+ metrics per dashboard. Complex visualizations that confuse instead of clarify.
Fix: Use the "5-second rule." Can someone glance at your report and understand the main point in 5 seconds? If not, simplify. Remove metrics that don't drive decisions.
4. Ignoring Data Quality
Problem: Unexplained spikes, impossible values, inconsistent totals.
Fix: Build quality checks into your process. Flag anomalies automatically. Compare totals across reports to catch discrepancies. Common issues:
- Tracking code breaks
- Timezone inconsistencies
- Currency conversion errors
- Duplicate tracking
- Bot traffic
5. No Connection to Action
Problem: Beautiful dashboards that teams check occasionally but don't use for decisions.
Fix: Include "recommended actions" in every report. Schedule meetings to review and make decisions. Track what actions you took and whether they worked.
Tools That Actually Matter
Data Integration
Automatically collect data from multiple platforms.
Need it when: Pulling from 3+ marketing platforms regularly.
Look for: Pre-built connectors, automatic scheduling, data validation, reasonable pricing.
Visualization
Turn data into understandable charts and dashboards.
Looker Studio: Free, web-based, integrates with Google products. Limited customization.
Power BI: Powerful for Microsoft ecosystem teams. Steeper learning curve.
Tableau: Industry-leading but expensive. Best for dedicated analytics roles.
Analytics Platforms
Google Analytics 4: Free website analytics. Essential for any team with a website.
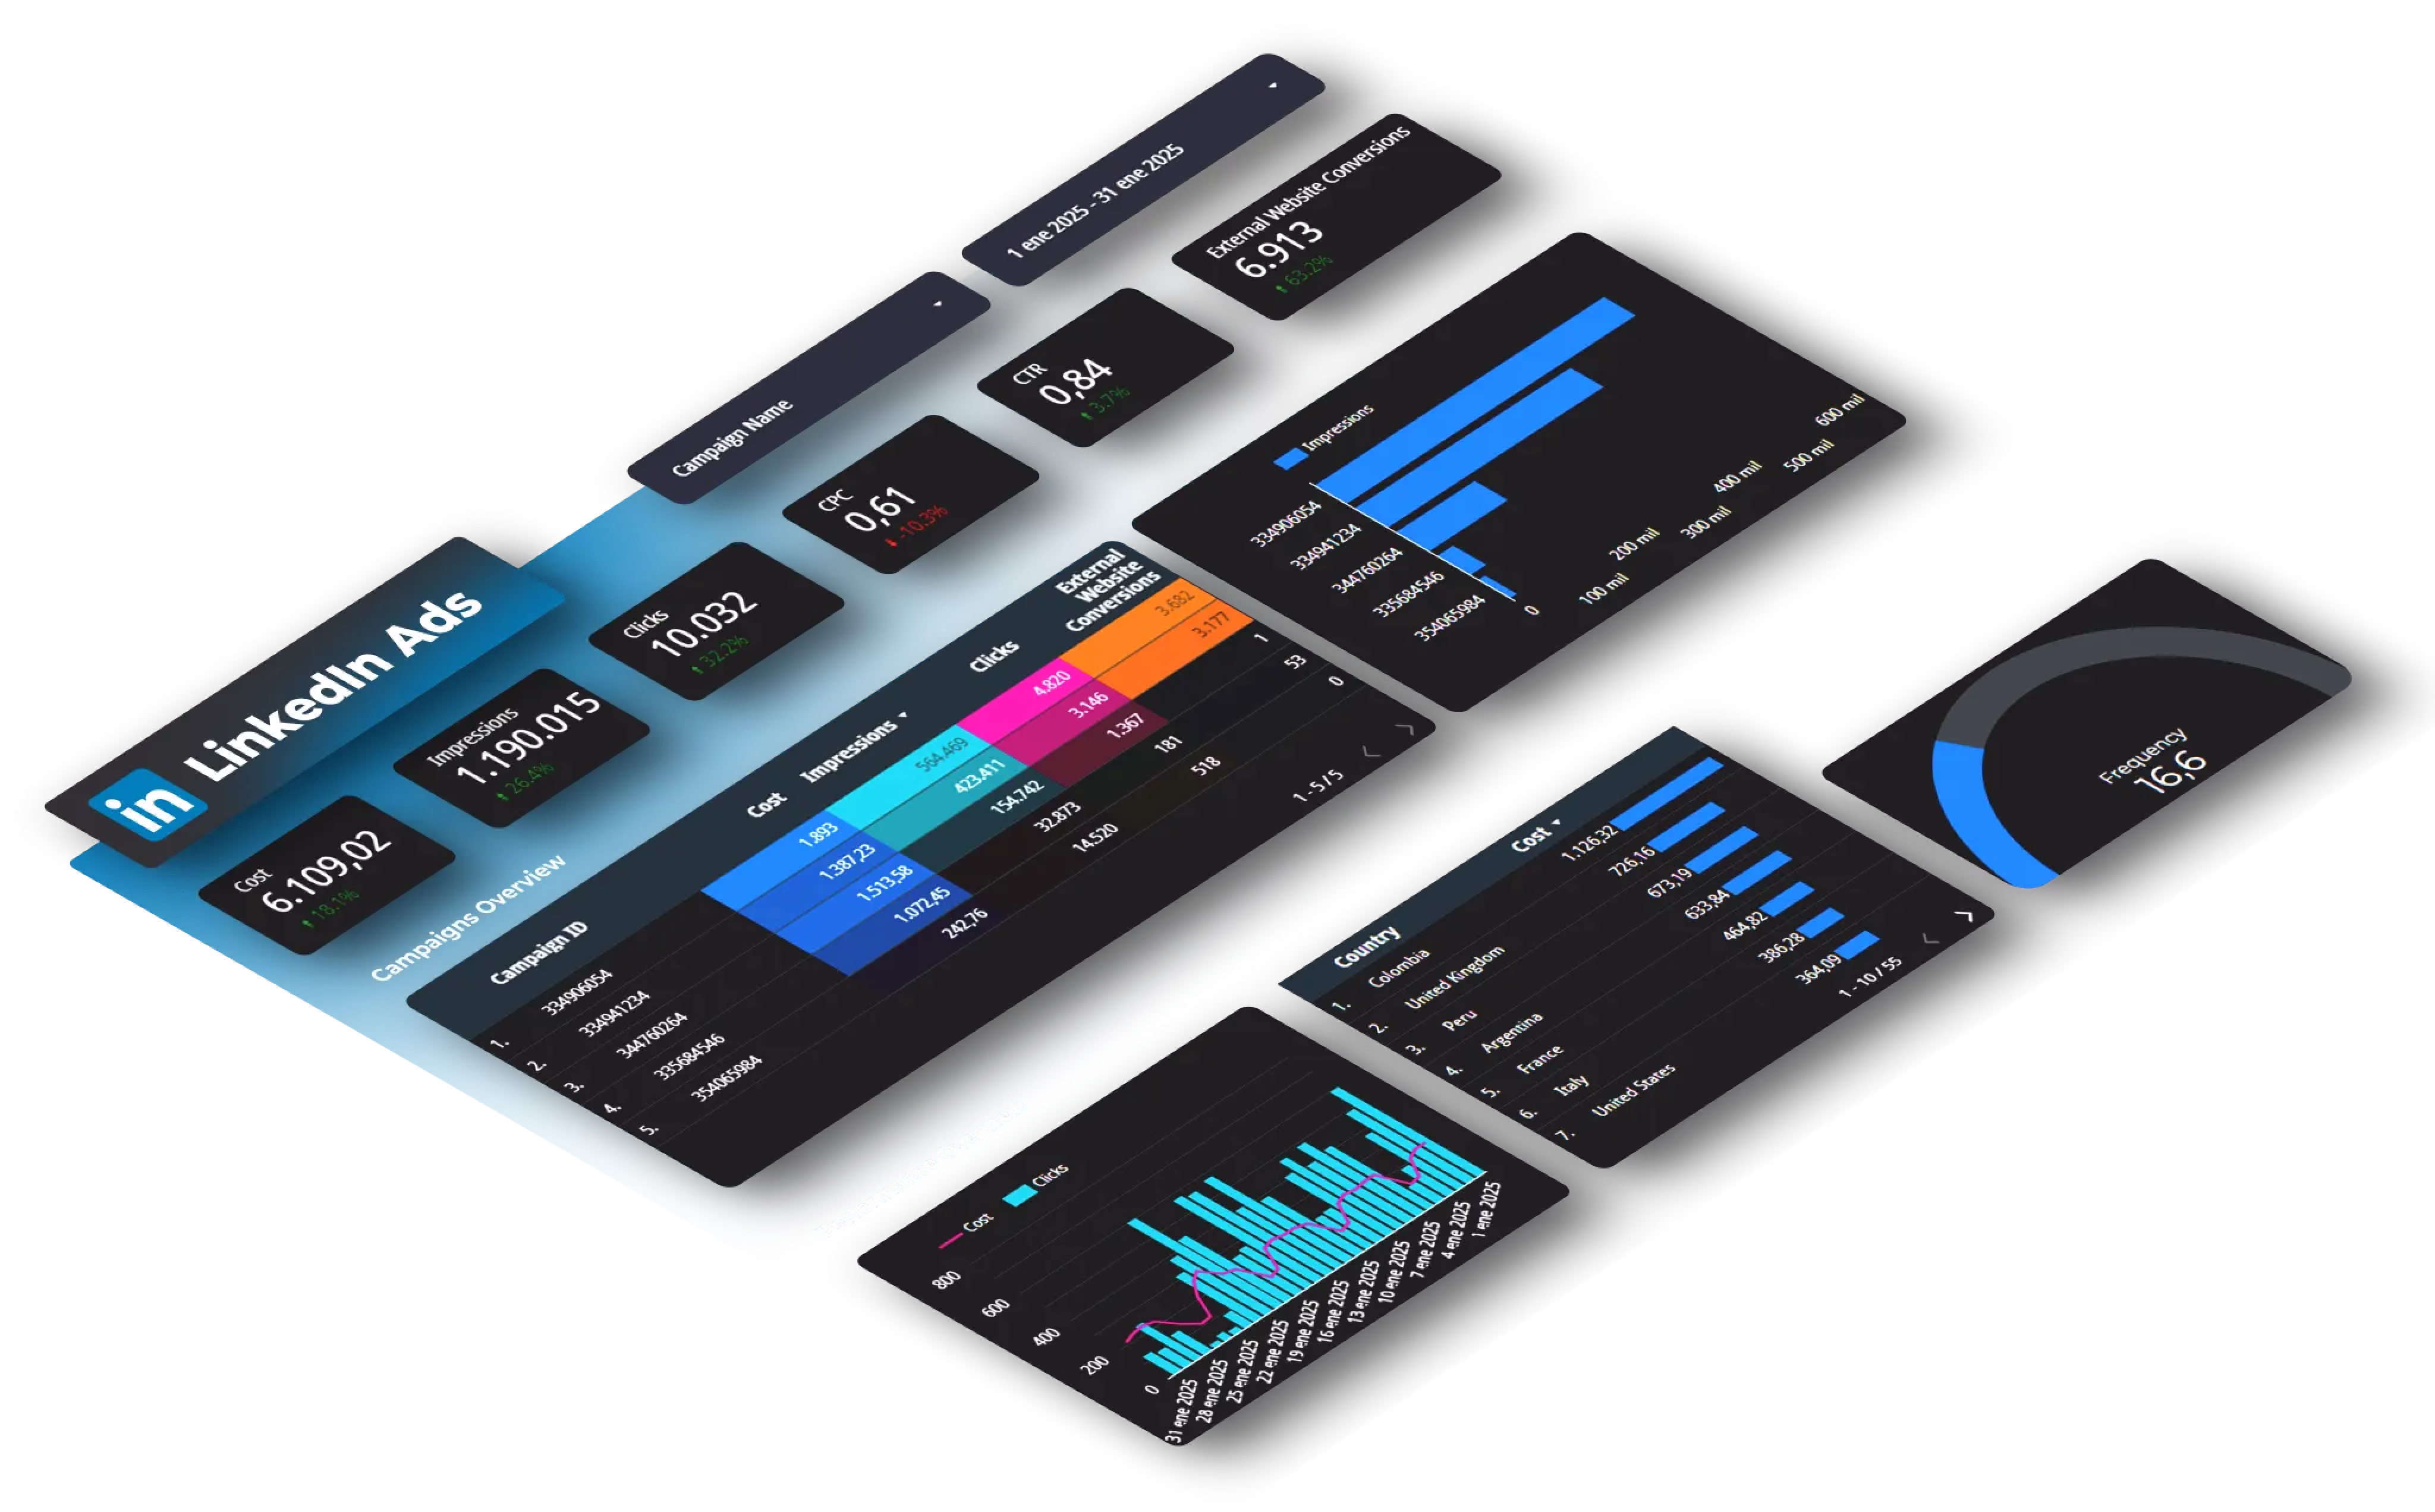
Platform-specific: Facebook Ads Manager, Google Ads, LinkedIn Campaign Manager provide detailed campaign data.
Data Warehouses
Centralized storage for scale.
Need it when: High data volumes, complex analysis, or multiple teams needing access.
BigQuery: Serverless, pay-per-query. Good starting point.
Snowflake: Flexible and powerful. More expensive.
Most small to mid-size teams don't need a warehouse initially. Start simpler and graduate when you outgrow it.
What's Coming in 2026: AI and Real-Time Reporting
AI-Powered Analytics
Current applications that work:
Automated anomaly detection: Spots unusual patterns instantly. Your cost per conversion jumped 40%. AI flags it and suggests causes.
Natural language queries: Ask "Which campaigns had ROAS above 3x last month?" Get a data table without SQL.
Automated insights: AI surfaces notable findings you might miss. Trending changes, segment differences, optimization opportunities.
Real-Time Decision Making
Instant adjustments: Automated rules that adjust bids, pause underperformers, scale winners.
Live monitoring: Real-time visibility with alerts for anything unusual.
Teams that optimize daily instead of weekly make 20+ additional improvements per quarter, each incrementally increasing performance.
Unified Customer View
Breaking down data silos:
Cross-device tracking: Connect mobile clicks to desktop purchases.
Offline-to-online: Link in-store purchases to digital touchpoints.
Multi-platform identity: Recognize customers across email, social, website, mobile app.
Your Next Steps
Week 1: Audit current reporting. List every report, who uses it, whether it drives decisions. Eliminate unused reports.
Week 2: Define 5-10 core KPIs that connect to business goals. Document exactly how you calculate each.
Week 3: Set up automated data collection. Stop manual exports.
Week 4: Create your first automated report. Start simple, one report for one audience. Make it update automatically.
Month 2: Build channel-specific dashboards for each team member.
Month 3: Implement your action process. Set triggers, schedule reviews, document learnings.
The goal isn't perfection on day one. It's building a system that improves incrementally and compounds over time.
Want to automate data collection across multiple platforms? Try Dataslayer free for 15 days to connect Google Ads, Facebook Ads, LinkedIn Ads, Google Analytics, and 50+ platforms to Google Sheets, Looker Studio, or BigQuery.
FAQ
What's the difference between marketing analytics and marketing reporting?
Analytics is analyzing data to find patterns and insights. Reporting is communicating those findings to stakeholders. You need both. Analytics finds what matters, reporting shares it with people who can act.
How often should I create marketing reports?
Active campaigns need daily reports. Strategic decisions need monthly or quarterly reports. Set frequency based on how often the data meaningfully changes and how often decisions get made.
What are the most important marketing KPIs?
Focus on metrics that connect to business outcomes: customer acquisition cost (CAC), return on ad spend (ROAS), conversion rate by channel, customer lifetime value (LTV), and marketing efficiency ratio. Avoid vanity metrics.
Do I need a data warehouse?
Most small to mid-size teams don't initially. Start with Google Sheets and automated data integration. Consider a warehouse when you have high data volumes, complex analysis needs, or multiple teams needing access.
How do I get stakeholders to use my reports?
Create stakeholder-specific reports that answer their exact questions. Keep reports simple, include interpretation (not just data), and connect findings to specific actions they can take.
How do I measure ROI across multiple channels?
Use attribution modeling to assign value to each touchpoint. Start with simple models (first-touch or last-touch) and evolve to multi-touch attribution. Include all costs in your calculations.
What if my data doesn't match across platforms?
This is extremely common. Platforms use different tracking methods, attribution windows, and counting rules. Choose one platform as your source of truth for each metric and be consistent.


