

Pinterest Ads delivers 2.3x lower cost per conversion than Facebook and Instagram. But most marketers track only the basics (impressions, clicks, spend) and miss the metrics that predict long-term revenue: save rate, earned impressions, and 30-day attribution.
If you're measuring Pinterest performance solely in the native dashboard, you can't see how it stacks up against Google Ads CPA or Meta ROAS. And you're definitely missing the earned impressions that keep driving traffic weeks after your campaign ends.
Let's see how to build a Pinterest Ads reporting system that shows you what's actually working.
Why Pinterest Ads Metrics Are Different
Pinterest isn't social media. It's a visual search engine where 97% of searches are unbranded, and 90% of users browse with purchase intent. That fundamental difference shows up in metrics you won't find on Facebook or Instagram.
The Four Pinterest-Specific Metrics to Track
Save Rate (Repin Rate)
Save rate tells you what percentage of people who see your Pin save it to their boards. Industry benchmarks from Pinterest's official analytics documentation:
- General: 0.2-0.5%
- Food, DIY, Fashion: 1-2%
- Home goods: 0.8-1.5%
A high save rate signals future purchase intent, something a Facebook "like" can't tell you.
Earned Impressions
When someone saves your promoted Pin, it keeps appearing in feeds and search results after your campaign stops. These earned impressions cost nothing but drive traffic for months.
According to Pinterest Business, successful campaigns average 2-3x more earned impressions than paid impressions. This metric doesn't exist on platforms where ads disappear when you stop paying.
Outbound Clicks vs Pin Clicks
- Pin clicks: Users click to view your Pin up close
- Outbound clicks: Users click through to your website
Track the ratio between these. High Pin clicks with low outbound clicks means your creative grabs attention but your CTA needs work.
30-Day Attribution Windows
Pinterest lets you set attribution from 1-60 days for both clicks and views. This matters because Pinners research for weeks before buying. The default 30-day window captures behavior that Facebook's 7-day window misses entirely.
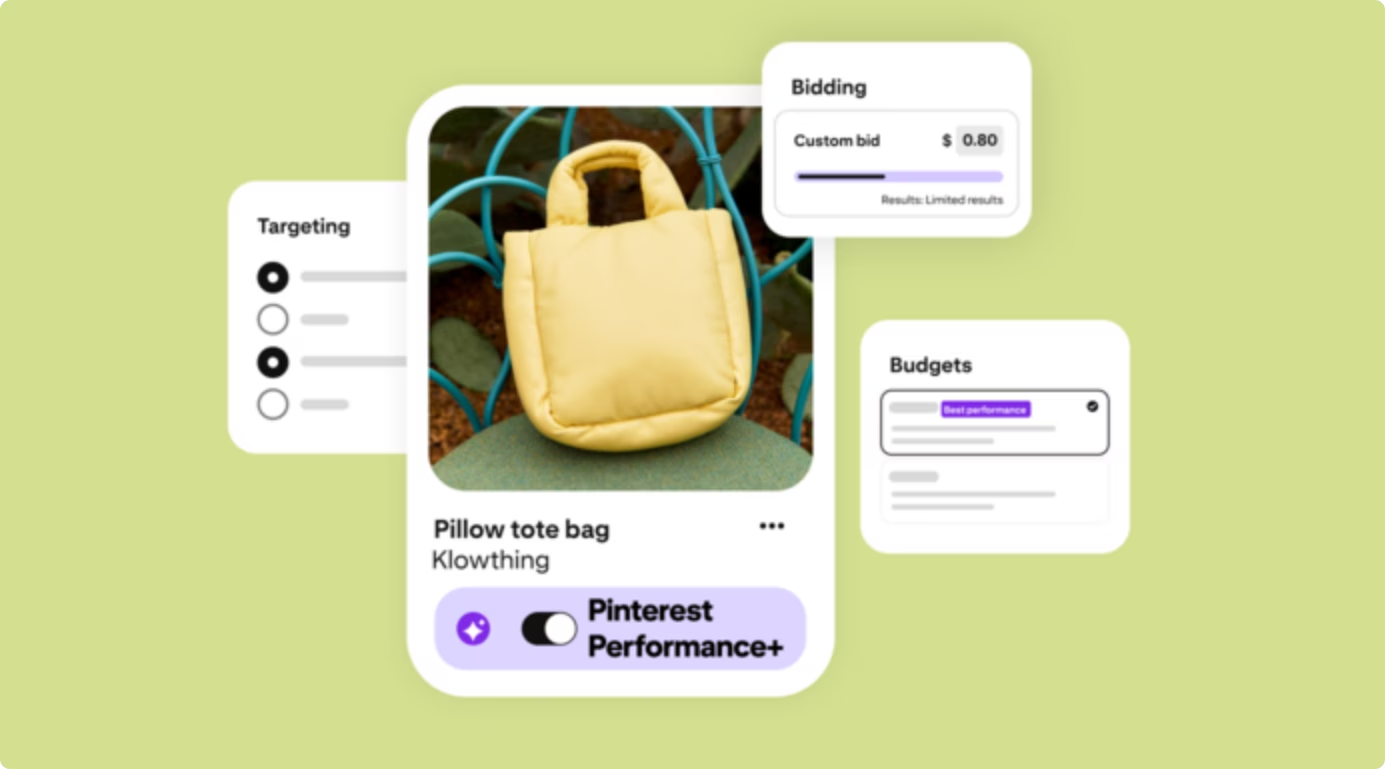
Setting Up Pinterest Ads Reporting in Looker Studio
Step 1: Connect Your Pinterest Account
Most marketing teams use a connector to pull Pinterest Ads data into Looker Studio automatically. The setup process typically involves:
- Authorizing your Pinterest Business account
- Selecting which ad accounts to track
- Choosing your destination (Looker Studio, Google Sheets, data warehouse)
Step 2: Configure Attribution
Pinterest offers 10 conversion window options. Choose the window that matches your sales cycle:
Set "Conversion date for daily reporting" to "Date of ad event" to see when impressions happened, not when conversions occurred weeks later.
Step 3: Build Your Report with Essential Metrics
Top-of-Funnel:
- Total Impressions (paid + earned breakdown)
- Impressions Earned
- CPM
Engagement Signals:
- Pin Clicks
- Total Repins (saves)
- Save Rate
- Outbound Clicks (paid + earned)
Conversions:
- Total Conversions
- Cost per Conversion
- Checkout ROAS
- Web Checkout Value
Video (if applicable):
- Video Views (2+ seconds, 50% in view)
- Completion at 50%, 75%, 100%
Why Pinterest Outperforms for E-commerce
Pinterest's audience is built differently than other platforms:
- 47% more likely to discover new brands through ads than on Facebook (Pinterest Business data)
- 14+ minute average session duration vs under 5 minutes on Instagram
- 40% of users earn $150K+ annually
- 85% of weekly users have made purchases based on Pins (updated 2026 data)
Performance Benchmarks by Industry
Based on 2025-2026 campaign data:
A home decor brand discovered that Pins with save rate above 1.2% drove 62% more revenue within 60 days than low-save Pins with immediate clicks. They switched from optimizing for click volume to targeting high save rate. ROAS jumped from 2.1x to 4.3x.
Common Pinterest Ads Reporting Mistakes to Avoid
Mistake #1: Tracking Only Paid Metrics
If your report shows only impression_1 (paid impressions), you're missing 60-70% of total reach. Promoted Pins keep generating earned impressions after campaigns end.
The solution: Add metric pairs to your reporting dashboard. Compare total impressions versus paid versus earned. Do the same for outbound clicks and repins. This shows the full picture of how your campaigns continue performing after you stop paying.
Mistake #2: Using 7-Day Attribution
Pinterest research cycles average 21-28 days for retail. A 7-day window undercounts conversions by 40-60%.
Start with 30-day click / 30-day view attribution. You can add a comparison column showing 7-day numbers to see the difference, but the 30-day window will capture the actual Pinterest user journey more accurately.
Mistake #3: Ignoring Save Rate
Save rate predicts future revenue better than immediate clicks for products with research phases.
Make save rate a primary KPI in your reports. Set up alerts for Pins that exceed 1% save rate in your vertical. These are your long-term revenue drivers.
Mistake #4: Comparing Pinterest to Facebook Without Context
Pinterest CPA looks higher than Facebook in the first 30 days because Pinners research longer. But lifetime value tells a different story.
Segment your Pinterest Ads reporting by time frame. Look at short-term performance (7-day attribution) where Facebook may win, long-term performance (30-60 day attribution) where Pinterest often wins, and earned value metrics that are unique to Pinterest.
What to Include in Your Pinterest Ads Reporting Dashboard
Campaign Overview Page
- Date selector (default: Last 30 days)
- Total Spend vs Budget
- Total Impressions with paid/earned breakdown
- Outbound Clicks
- Average CPC
- Checkout ROAS
- Top 5 campaigns by ROAS
Engagement Metrics Page
- Save Rate trend (90-day line chart)
- Pin Clicks vs Outbound Clicks comparison
- Engagement Rate by ad group
- Earned Impressions as percentage of total
Conversion Analysis Page
- Conversion Rate by objective
- CPA by ad group
- Attribution comparison (7-day vs 30-day)
- Revenue by campaign
Creative Performance
- Top Pins by Save Rate
- Video completion rates
- Performance by Pin creative type (Standard, Video, Carousel, Shopping)
If you're running ads on multiple platforms, add a cross-channel comparison page showing how Pinterest ROAS and CPA stack up against Google Ads and Meta.
Automating Your Pinterest Ads Reporting
Manual Pinterest reporting means logging into the platform, adjusting date ranges, exporting CSVs, and copying data into spreadsheets or presentations. For a single client or campaign, this might take 20-30 minutes weekly. For agencies managing multiple accounts, it becomes hours of repetitive work.
Automated reporting pulls data directly from Pinterest's API on a schedule you set (daily, weekly, or monthly). The reports update themselves, and you can share live dashboards that stakeholders access anytime.
What automation solves:
- No more manual CSV exports from Pinterest Ads Manager
- Historical data stored beyond Pinterest's 90-day limit
- Cross-platform reporting (Pinterest + Google + Meta in one view)
- Scheduled delivery to clients or team members
- Consistent formatting across all reports
Most marketing teams use connectors that support multiple destinations: Looker Studio for visual dashboards, Google Sheets for data analysis, BigQuery for warehousing, or Power BI for enterprise reporting.
Related: Marketing Data Integration Guide covers strategies for connecting multiple ad platforms into unified reports.
Start Tracking Pinterest Ads Metrics That Matter
Pinterest's unique metrics (earned impressions, save rate, extended attribution) make it powerful for e-commerce. The native Pinterest dashboard shows you campaign performance, but it can't compare Pinterest against your other channels, won't store data beyond 90 days, and requires manual work for every report.
The difference between tracking basic metrics (impressions, clicks) and Pinterest-specific metrics (save rate, earned impressions, 30-day attribution) is the difference between knowing your ads ran and knowing which ads drive revenue 60 days later.
Or explore pre-built templates: Free Looker Studio Templates for Pinterest and other marketing platforms.
Also useful: Google Ads to Google Sheets guide if you're automating reporting for multiple ad platforms, and Marketing Dashboard Best Practices for structuring cross-channel reports.


