


Getting your TikTok Ads data into Google Sheets lets you analyze performance, create custom reports, and share results with clients or stakeholders without paying for expensive analytics platforms. This guide covers three methods to connect TikTok Ads to Google Sheets: manual CSV exports (free), TikTok API with Google Apps Script (technical but free), and automated connectors (paid but time-saving). Each method works for different skill levels and budgets.
Method Comparison Table
Why Connect TikTok Ads to Google Sheets?
TikTok Ads Manager works fine for quick checks, but it has limitations that frustrate most marketers:
- You can't compare campaigns across date ranges easily. Want to see how January performed versus February? You'll need to manually switch dates and write down numbers.
- Custom calculations require leaving the platform. Need to calculate cost per video view or ROAS by product category? TikTok doesn't let you create custom metrics.
- Client reporting takes forever. If you manage multiple TikTok accounts, logging in and out to pull reports eats up hours every week.
- Historical data disappears. TikTok's interface changes frequently, and some metrics get renamed or removed. Having your own data archive in Google Sheets protects against this.
Getting TikTok data into Google Sheets cuts reporting time dramatically and gives you control over your advertising data.
Method 1: Manual CSV Export (Free, 5 Minutes)
This works for anyone who needs TikTok Ads data occasionally or runs small campaigns.
Step-by-Step Instructions
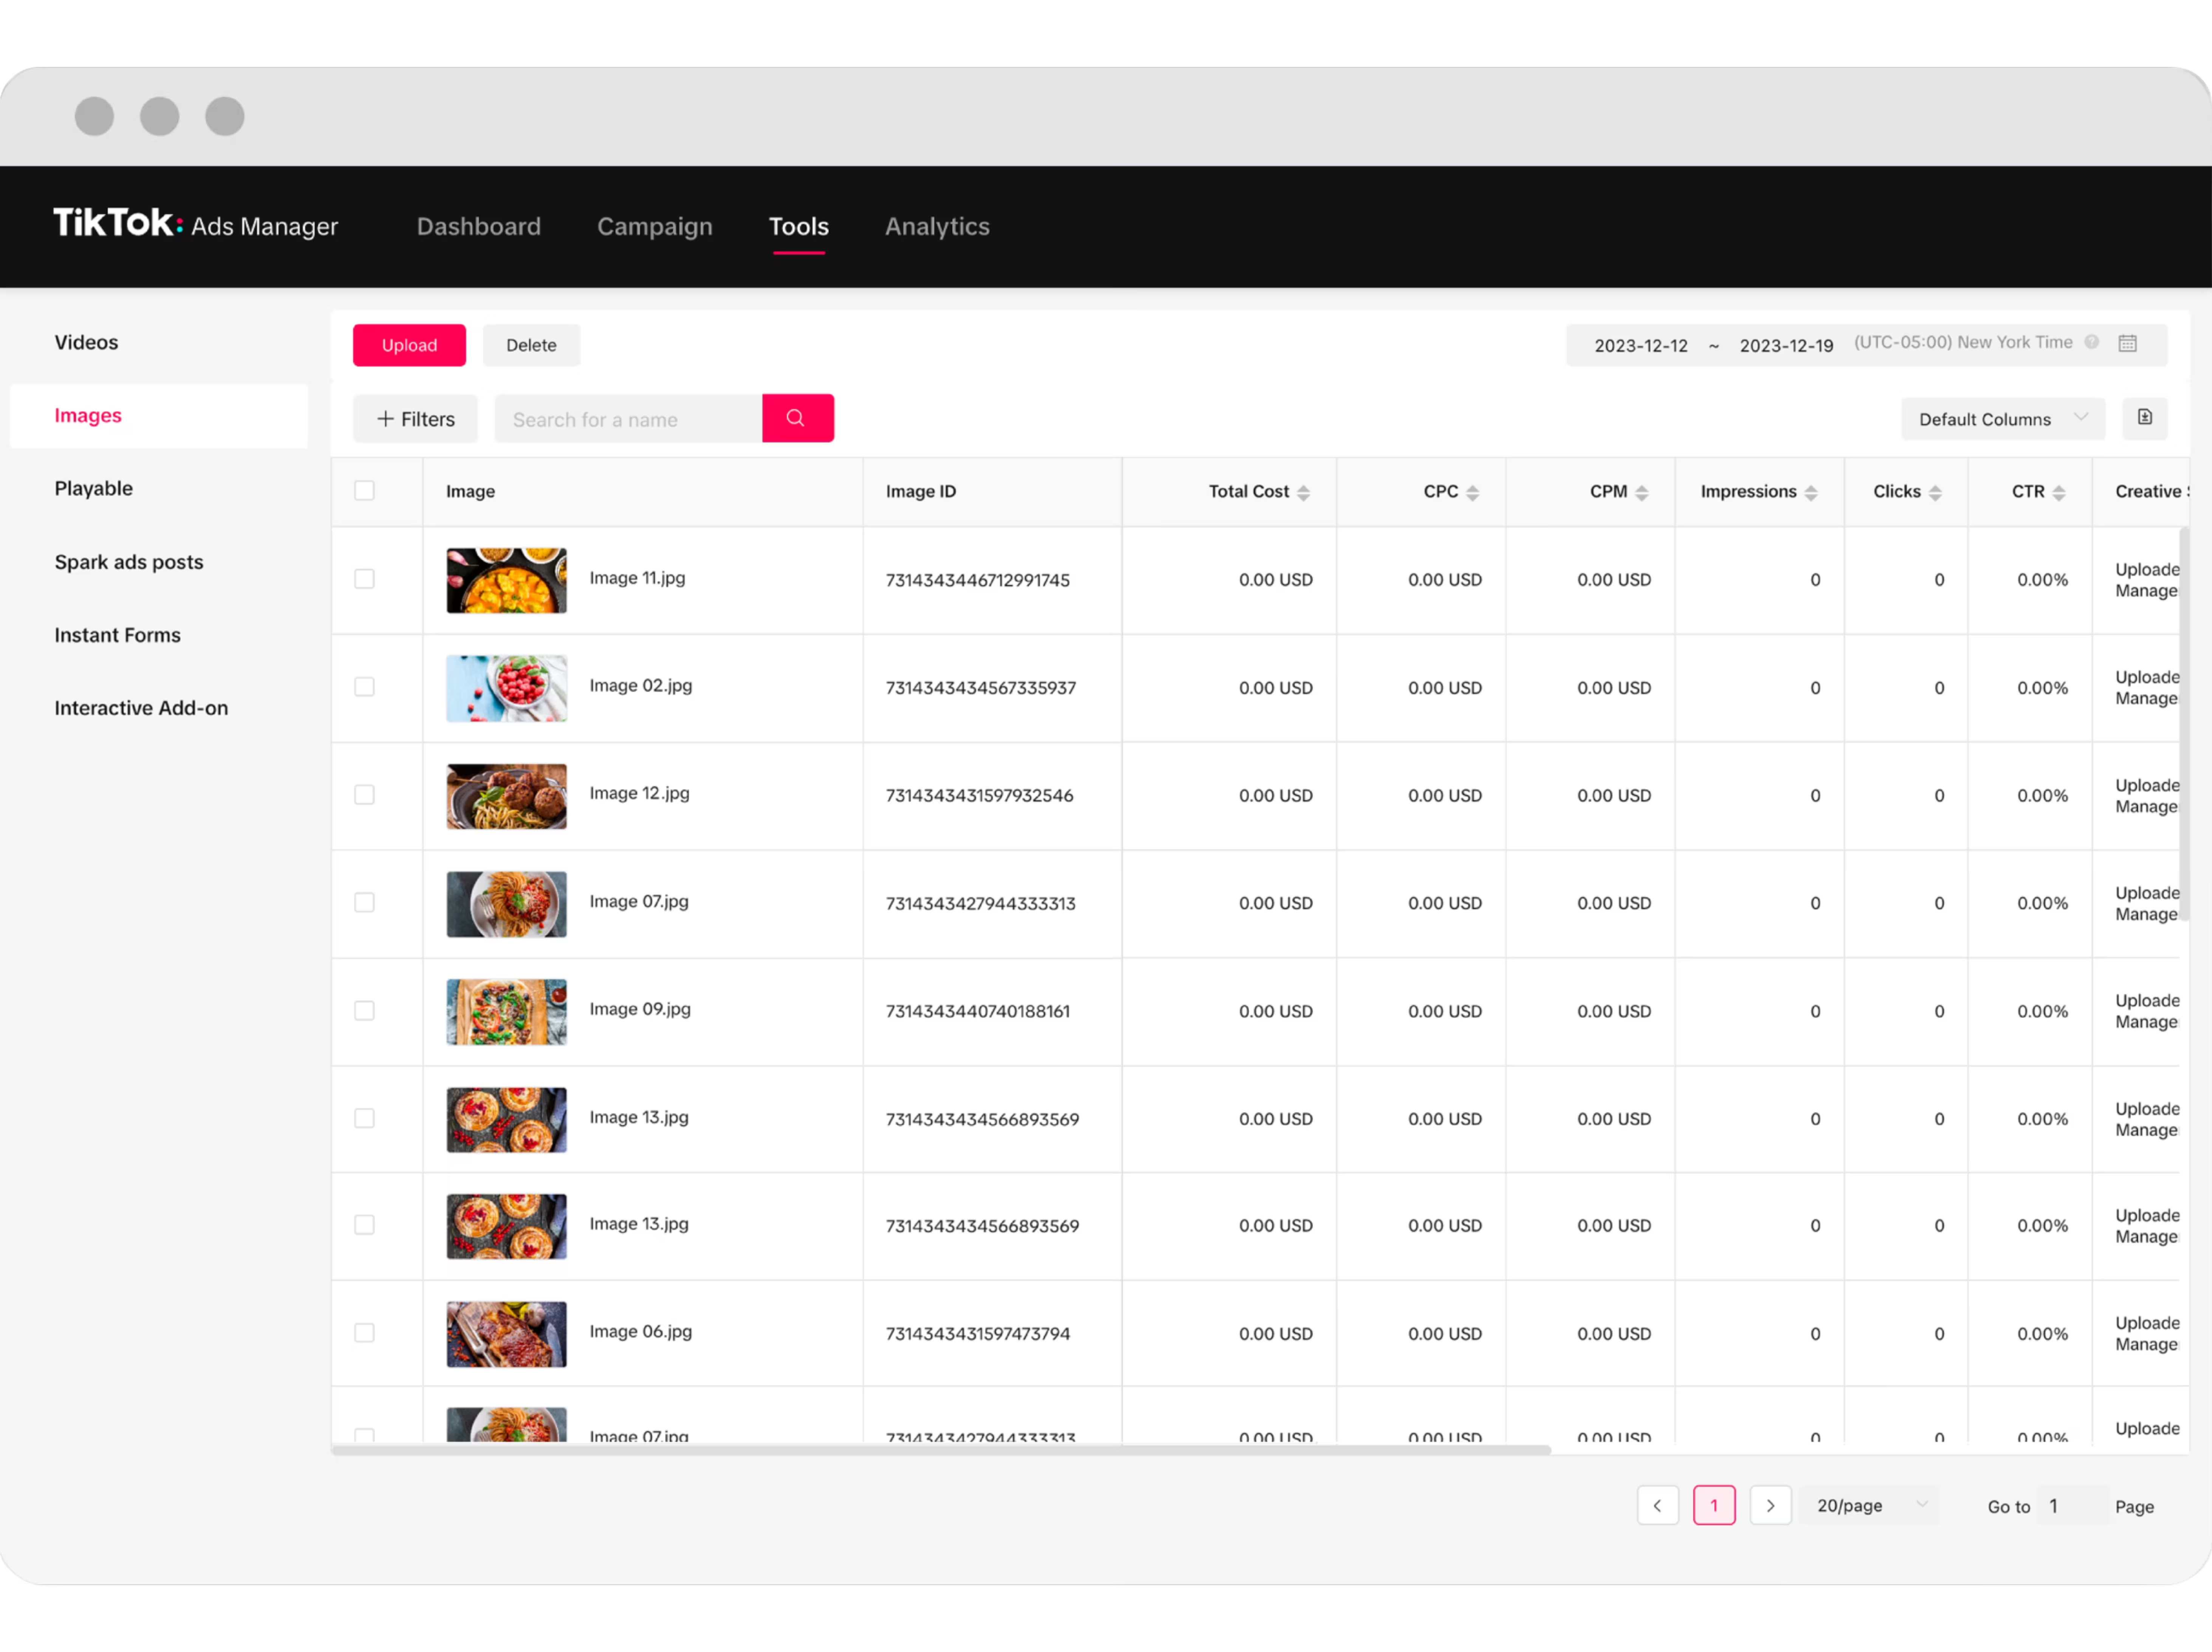
1. Log into TikTok Ads Manager at ads.tiktok.com
2. Navigate to Reports in the left sidebar (it's between "Campaign" and "Assets")
3. Select your data range:
- Click the date picker in the top right
- Choose "Last 30 days" or set custom dates
- TikTok allows up to 365 days in one export
4. Choose your report type:
- Campaign Report: High-level performance across all campaigns
- Ad Group Report: Breakdown by ad set
- Ad Report: Individual ad creative performance
- Audience Report: Demographics and interests
5. Select metrics to include:
- Click "Customize Columns"
- Check the metrics you need (impressions, clicks, conversions, cost)
- Pro tip: Select up to 30 metrics per export - any more and TikTok may timeout
6. Click "Export" in the top right:
- Choose "CSV" format (not Excel - CSVs work better with Google Sheets)
- File downloads to your computer
7. Upload to Google Sheets:
- Open Google Sheets
- Go to File → Import
- Upload the CSV file
- Choose "Replace spreadsheet" or "Insert new sheet"
- Select "Detect automatically" for separator type
When This Method Works Best
Manual exports make sense when:
- You run reports weekly or monthly (not daily)
- You manage 1-3 TikTok Ads accounts
- You need historical data for a presentation
- You're testing whether TikTok Ads works for your business
Example: Sarah runs a jewelry e-commerce store and spends $500/month on TikTok Ads. She exports data every Monday morning to update her weekly performance dashboard. Takes her 5 minutes, completely free.
Limitations
You'll quickly hit these walls:
- No automation - you must remember to export
- Data formatting issues - dates might appear as numbers, currencies may lose symbols
- Time-consuming at scale - managing 10+ campaigns means 10+ exports
- Historical gaps - if you forget to export, that data is hard to retrieve later
Method 2: TikTok API + Google Apps Script (Free, Technical)
If you know JavaScript and want complete control, you can build your own connection using TikTok's Marketing API and Google Apps Script.
Prerequisites
- TikTok Developer Account (free, but requires business verification)
- API Access Token (apply through TikTok for Business)
- Basic JavaScript knowledge
- Patience - expect 2-3 hours for initial setup
High-Level Process
1. Get TikTok API Access:
- Go to ads.tiktok.com/marketing_api
- Create a developer account
- Submit an application explaining your use case
- Wait for approval (typically 3-7 business days)
- Generate an Access Token with "Reporting" permissions
2. Set up Google Apps Script:
- Open your Google Sheet
- Go to Extensions → Apps Script
- Create a new script file
3. Build the connection:
You'll need to write a script that:
- Authenticates with TikTok's API using your Access Token
- Calls the reporting endpoint at business-api.tiktok.com/open_api/v1.3/report/integrated/get/
- Specifies your date range (start_date and end_date in YYYY-MM-DD format)
- Selects dimensions (campaign_id, ad_group_id, stat_time_day)
- Chooses metrics (spend, impressions, clicks, ctr, conversions, cpc, cpa)
- Parses the JSON response from TikTok
- Writes data to your Google Sheet in organized rows and columns
The main technical challenge is handling TikTok's pagination (they limit results to 1000 rows per request) and properly formatting dates for both the API call and Google Sheets display.
4. Schedule automatic updates:
- In Apps Script, click the clock icon (Triggers)
- Click "+ Add Trigger"
- Set your function to run daily at your preferred time
- Note: Google Apps Script has a 6-minute execution limit per run
For complete technical documentation and code examples, visit the TikTok Marketing API docs.
Real-World Example
Marcus runs a digital agency with 8 TikTok Ads clients. He built a custom Google Apps Script that pulls data every morning at 6 AM and populates individual client sheets. His setup took a weekend to build but saves him 12 hours per week compared to manual exports.
However, Marcus also maintains the code when TikTok updates their API (which happens 2-3 times per year).
When This Method Works Best
Choose the API approach if:
- You're comfortable coding or have a developer on your team
- You need custom metrics TikTok doesn't calculate
- You want to combine TikTok data with other sources in the same sheet
- You're running experiments and need granular control
Limitations
- High technical barrier - not feasible for most marketers
- Maintenance required - APIs change, code breaks
- Limited support - you're on your own if something fails
- API rate limits - TikTok restricts how many requests you can make per day
Method 3: Automated Data Connectors (Paid, Easiest)
The fastest path for most marketers is using a dedicated connector tool. These handle authentication, data syncing, and formatting automatically.
How Automated Connectors Work
- One-time setup: Authenticate your TikTok Ads account
- Select metrics: Choose which campaigns and metrics to track
- Set refresh schedule: Data updates automatically (hourly, daily, or weekly)
- Data appears in Google Sheets: Pre-formatted and ready to analyze
Popular Options
Several tools offer TikTok Ads to Google Sheets connections. You can do this manually, use platform exports, or automate with tools like Dataslayer if pulling from multiple ad platforms into the same sheet.
Step-by-Step with Dataslayer
Here's how the process works with an automated connector:
1. Sign up and connect your account:
- Create a Dataslayer account (15-day free trial, no credit card required)
- Go to Data Sources Hub
- Select TikTok Ads from the platform list
- Click "Add new account" and log in with your TikTok for Business credentials
2. Create a new query:
- Choose Google Sheets as your destination
- Install Datalsayer Add-on: In Google Sheets go to Extensions → Add-ons → Get add-ons → Download Dataslayer
- Once installed go to Extensions → Dataslayer → Launch sidebar
- Add a new query and select which TikTok Ads account to pull from (if you manage multiple)
- Pick your date range (yesterday, last 7 days, last 30 days, custom)
3. Select dimensions and metrics:
- Dimensions: Campaign name, ad group name, ad name, date
- Metrics: Impressions, clicks, CTR, conversions, cost, CPA, ROAS
- Preview shows exactly what your data will look like
4. Your data appears in Google Sheets:
- Open the Google Sheet URL provided
- Data refreshes automatically on your schedule
- Historical data accumulates over time
5. Configure automatic updates:
- Set refresh frequency (once daily at 9 AM, for example)
- Choose whether to append new data or replace the sheet

Advanced Use Cases
Combining Multiple Ad Platforms
The real power comes when you're running ads on TikTok, Facebook, Google, and others. Instead of juggling 5 different spreadsheets, you can:
- Pull all platforms into one master Google Sheet
- Create calculated columns for blended metrics
- Build unified reports that show cross-platform ROAS
- Compare which platform drives the lowest CPA
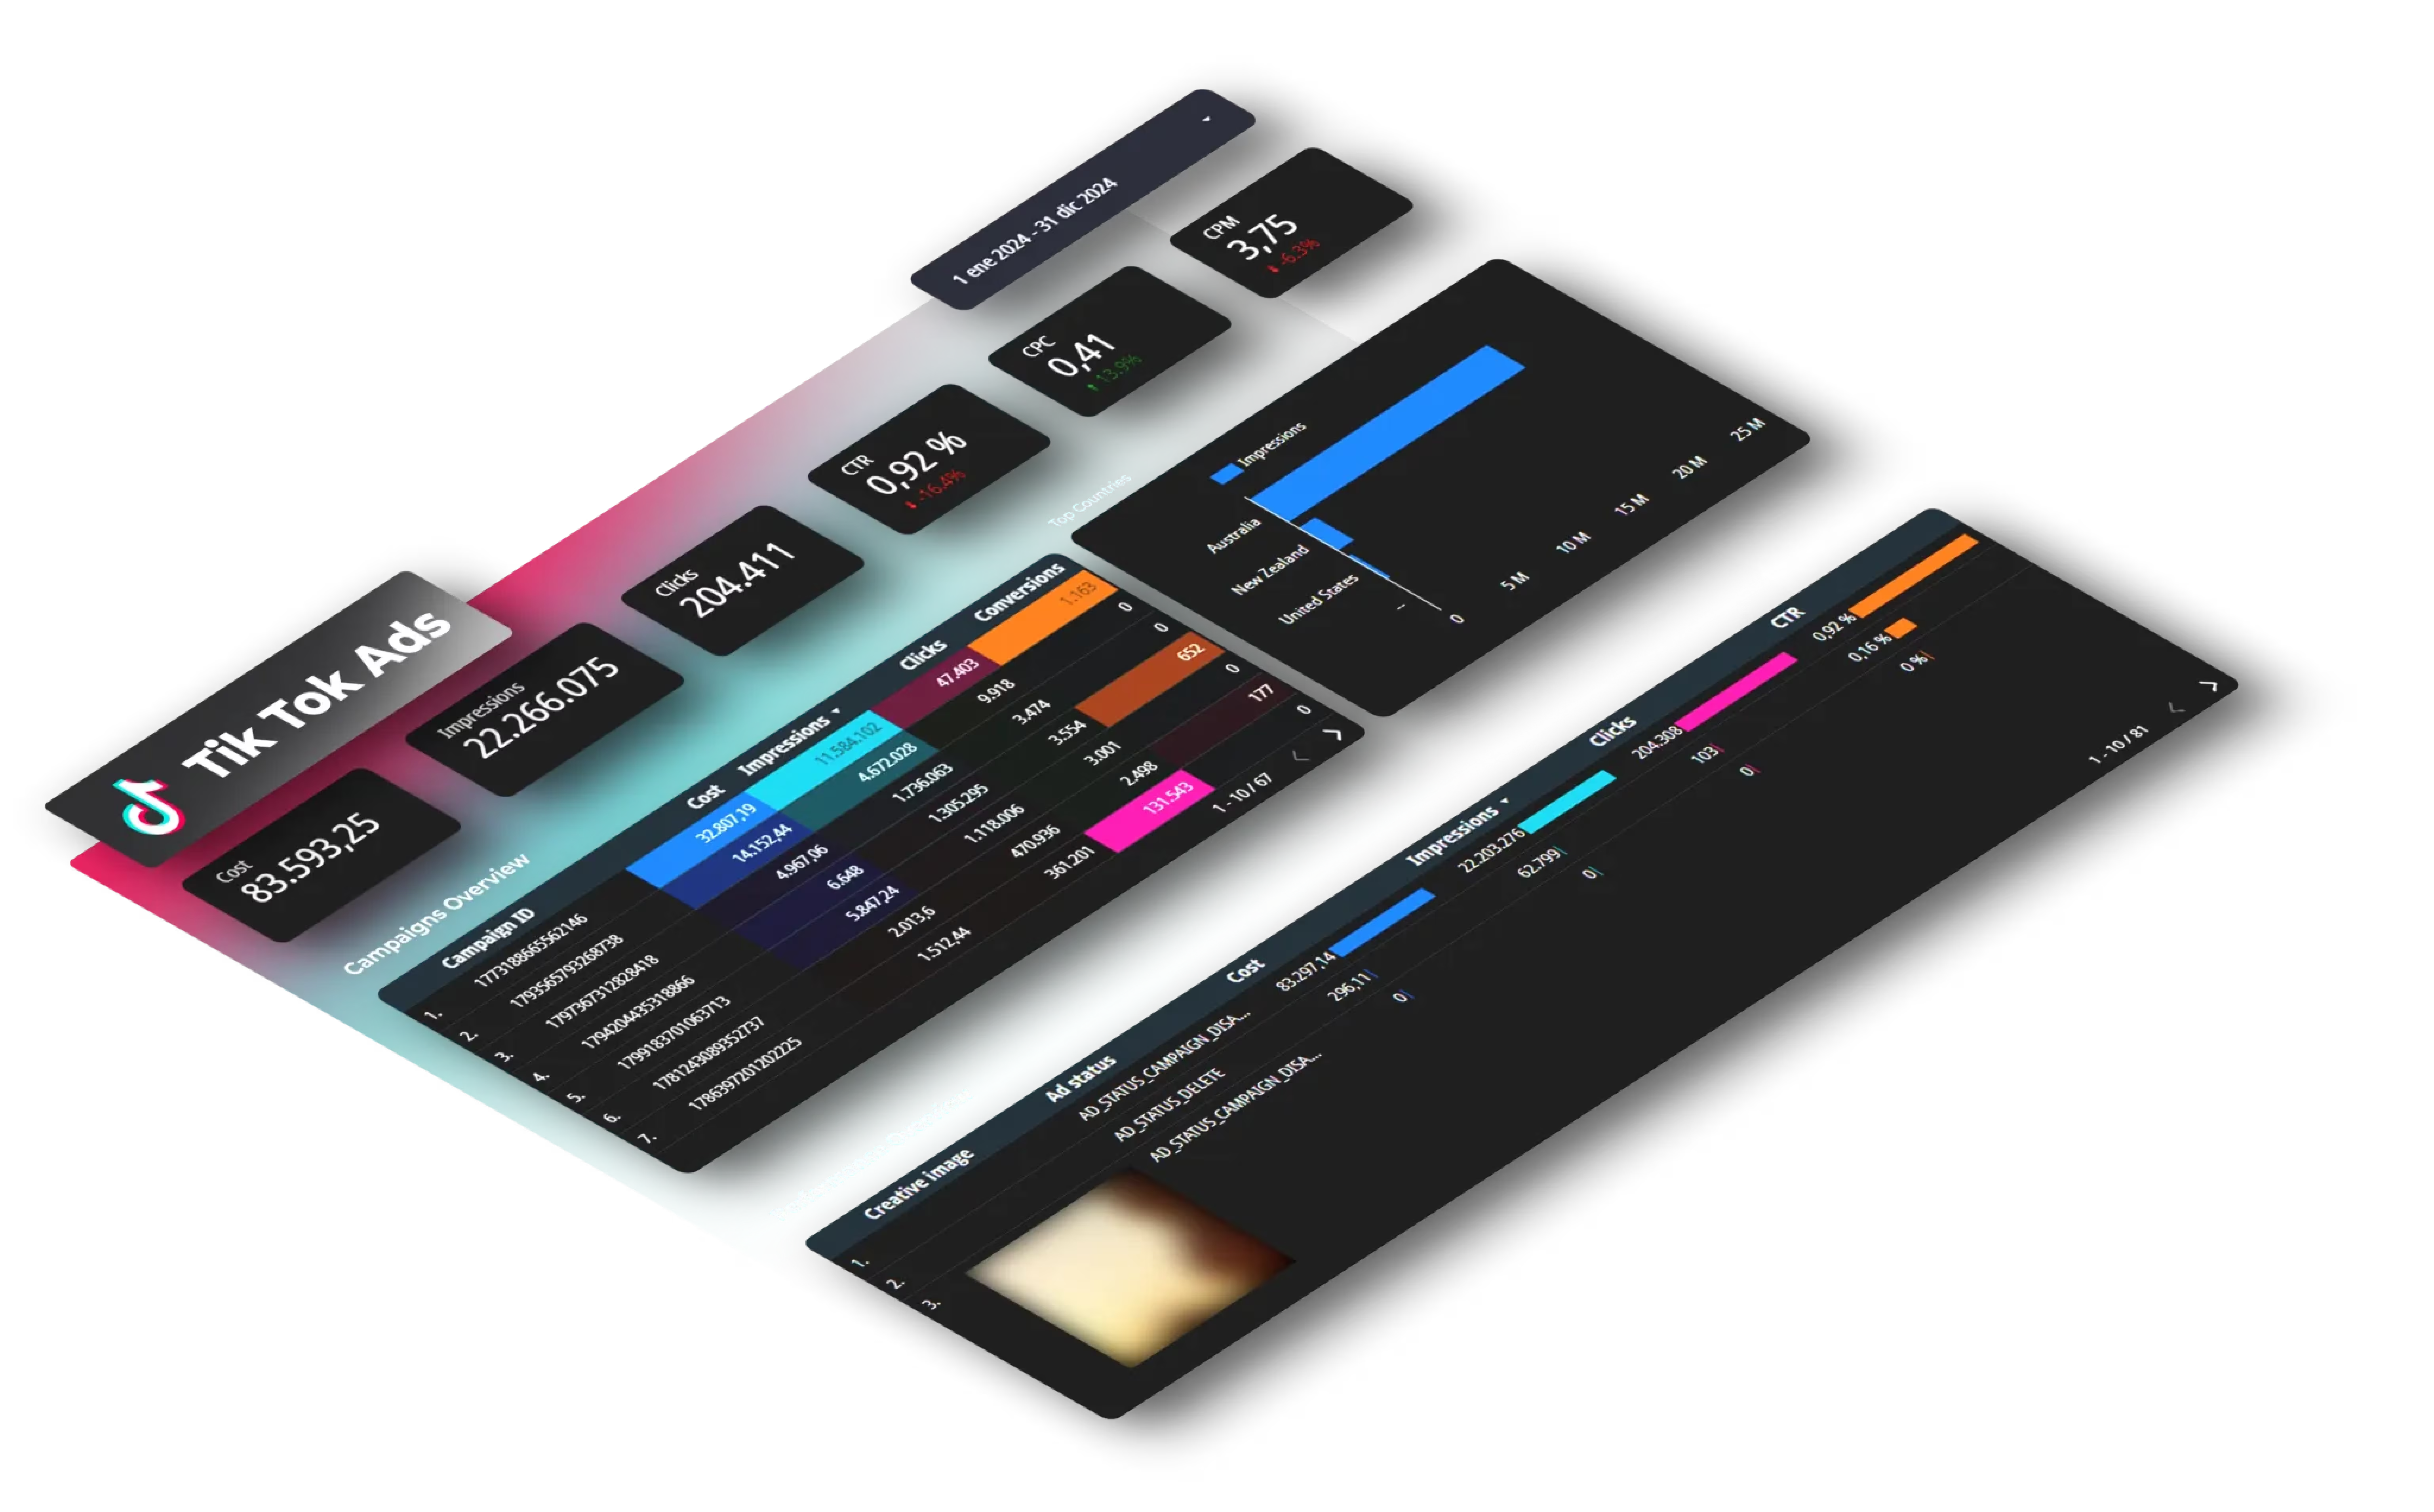
Example: Jennifer runs a SaaS company with a $15,000/month ad budget split across TikTok, Facebook, and Google Ads. She uses Dataslayer to combine all three into one Google Sheet, then connects that sheet to Looker Studio for live dashboards. Her CEO can check performance anytime without asking for reports.
Pricing Considerations
Most automated connectors charge based on:
- Number of data sources (1 TikTok account vs. 10)
- Refresh frequency (daily vs. hourly)
- Data volume (rows of data per month)
Typical pricing: $49-$149/month depending on your needs.
Is it worth it? If you're spending more than 2 hours per week on manual reporting, automation pays for itself. At $100/month, you're paying around $5 per hour saved if it saves you 20 hours monthly.
Setting Up Your Google Sheets Dashboard
Once your TikTok Ads data is in Google Sheets, here's how to make it actually useful:
Essential Calculations
Calculate ROAS (Return on Ad Spend):
- Divide total conversion value by total cost
- Formula structure: sum of conversion values divided by sum of costs
- Shows how much revenue each dollar of ad spend generates
Identify your best-performing ad:
- Use INDEX and MATCH functions together
- Finds the campaign or ad name with the highest value in your chosen metric
- Helps you quickly spot winners worth scaling
Track week-over-week changes:
- Calculate percentage change between time periods
- Subtract previous period from current period, then divide by previous period
- Multiply by 100 to get percentage change
Dashboard Structure
Create separate sheets within your workbook:
- Raw Data - where TikTok data lands automatically or via import
- Summary Dashboard - key metrics at a glance (total spend, ROAS, best performers)
- Campaign Analysis - detailed breakdowns by campaign, ad group, or creative
- Historical Trends - month-over-month or week-over-week comparisons
Pro tip: Use Google Sheets' QUERY function to filter and aggregate data without changing your source sheet. This lets you pull only active campaigns, group by specific dimensions, and calculate sums—all while keeping your raw data intact.
Common Issues and Solutions
Problem: TikTok Dates Import as Numbers
When you import a CSV, dates might appear as "44927" instead of "01/15/2026".
Solution: Select the date column, go to Format → Number → Date. Alternatively, use a TEXT formula to convert the serial number to a readable date format like MM/DD/YYYY.
Problem: Currency Symbols Disappear
Your $45.67 cost shows as 45.67 without the dollar sign.
Solution: Select the column → Format → Number → Currency. This applies proper currency formatting with your local currency symbol.
Problem: Data Doesn't Match TikTok Ads Manager
Your Google Sheet shows different numbers than TikTok's interface.
Causes:
- Time zone differences - TikTok uses the account's time zone; your export might use UTC
- Attribution windows - TikTok default is 7-day click, 1-day view
- Cached data - TikTok Ads Manager sometimes shows cached data; exports are final
Solution: Always compare like-for-like. Export data with the same date range and attribution window you're viewing in the platform.
Problem: Google Sheets Hits Row Limits
Google Sheets has a 10 million cell limit (not rows, but total cells across all sheets in a workbook).
Solution:
- Archive old data to separate sheets monthly
- Use filters to import only necessary campaigns or date ranges
- Consider upgrading to BigQuery for unlimited storage (connects the same way as Google Sheets)
FAQ
How often should I refresh TikTok Ads data in Google Sheets?
Daily refreshes work for most marketers. TikTok's data is usually final within 24-48 hours due to attribution windows. Hourly refreshes rarely provide value since conversions continue to roll in after the initial click. If you're spending $10,000+/day, consider twice-daily updates (morning and evening) to catch issues faster and make optimization decisions in real-time.
Can I pull data from multiple TikTok Ads accounts into one Google Sheet?
Yes, but the method depends on your approach. Manual CSV exports require separate tabs per account, which you can then consolidate using formulas or pivot tables. The TikTok API supports multi-account access if you have proper permissions and advertiser IDs. Automated tools like Dataslayer let you select multiple accounts and combine them into one sheet with an "Account Name" column to differentiate between them.
What metrics from TikTok Ads can I export to Google Sheets?
TikTok allows dozens of metrics including: impressions, clicks, click-through rate (CTR), video views, video play completions, cost per click (CPC), conversions, cost per acquisition (CPA), return on ad spend (ROAS), video completion rate, engagement rate, reach, frequency, and basic audience demographics like age and gender breakdowns. You can't export detailed audience interest data or granular placement breakdowns via standard API or CSV exports.
Is my TikTok Ads data safe when using third-party connectors?
Reputable connectors use OAuth authentication and don't store your TikTok credentials. When you "connect" TikTok Ads, you're giving the tool permission to read your advertising data (not modify campaigns or budgets). Check that any tool you use: (1) uses OAuth 2.0 authentication, (2) has ISO 27001 certification or equivalent security standards, and (3) clearly states their data retention and privacy policy. Never share your TikTok username and password directly with any third-party tool.
Can I automate Google Sheets reports to send via email?
Yes, Google Sheets has built-in email scheduling. Create your dashboard, then go to File → Share → Schedule emails. You can send daily, weekly, or monthly snapshots to clients or team members automatically. The email includes a PDF attachment of the sheet. For more control over formatting and content, use Google Apps Script with the MailApp service to customize exactly what gets sent, to whom, and in what format.
What's the difference between TikTok Ads Manager reporting and Google Sheets data?
TikTok Ads Manager shows real-time data; exported data is finalized. The platform displays live campaign status including pending conversions that haven't fully attributed yet. When you export to Google Sheets, TikTok finalizes all attribution based on your selected window (7-day click, 1-day view by default). This means a campaign showing 100 conversions in Ads Manager might export as 95 conversions because 5 were still pending. Always wait 48 hours after a campaign ends before exporting final performance data for accurate reporting.
How much does it cost to connect TikTok Ads to Google Sheets?
Manual CSV exports are always free. Building your own connection using TikTok's API and Google Apps Script is free but requires 2-4 hours of development time plus ongoing maintenance. Automated connector tools typically cost $49-$149/month depending on data volume, number of accounts, and refresh frequency. To calculate ROI: if manual exports take 5 hours/month and you value your time at $50/hour, spending $99/month on automation saves you $151 in time value each month.
Next Steps
Start with the method that matches your current situation:
- If you're just starting with TikTok Ads: Use manual CSV exports for the first month. This helps you understand what data matters before investing in automation. Focus on the metrics that directly impact your business goals.
- If you're running 5+ campaigns consistently: Set aside a weekend to build the Apps Script connection or start a trial with an automated connector. The time savings appear immediately, and you'll avoid the risk of forgetting manual exports.
- If you're managing multiple clients or accounts: Automation isn't optional anymore. Manual reporting doesn't scale past 3-4 accounts without burning out or missing critical data.
The key is getting your TikTok Ads data where you can actually analyze it. TikTok's built-in reporting works for quick checks, but serious optimization requires exporting data to Google Sheets where you control the format, calculations, and historical archives.
Want to automate this completely? Try Dataslayer free for 15 days to connect TikTok Ads, Facebook Ads, Google Ads, and other platforms to Google Sheets, Looker Studio, BigQuery, or Power BI, no credit card required at dataslayer.ai.


