
If you run a Shopify store, you already have four dashboards fighting for your attention. Shopify Analytics shows total orders. Google Analytics 4 shows sessions and events. Meta Ads Manager claims one revenue number. TikTok and Google Ads each show something else. None of them agree, none of them talk to each other, and none of them show retention alongside acquisition. A Shopify reporting dashboard fixes that by unifying order data, ad spend, and post-purchase metrics into one Looker Studio view. This playbook covers what actually matters for Shopify reporting in 2026: the KPIs to track, the Looker Studio setup step-by-step, five dashboard blueprints you can build in under an hour, and the common mistakes that make Shopify dashboards misleading. For most stores under $5M ARR, a Shopify + Meta + Google + TikTok connector stack into Looker Studio is enough. No dedicated BI platform required.
TL;DR
- Shopify's native Analytics is a solid source of truth for orders but does not reconcile with Meta, Google, or TikTok reported revenue. You need a unified dashboard for the full picture.
- The Shopify reporting stack that works for most stores under $5M ARR: Dataslayer connectors, Looker Studio dashboard, optional BigQuery for advanced modeling.
- The 12 KPIs that matter for Shopify in 2026 span revenue, acquisition, retention, funnel, and post-purchase. Most dashboards miss retention entirely.
- Common mistake: building the dashboard once and never refreshing attribution windows. Meta, Google, and TikTok have adjusted defaults multiple times since 2024, with further changes expected in 2026. Verify current settings at each platform's help center before every reporting cycle.
- For most stores under $5M ARR, a full BI platform isn't required. A Looker Studio dashboard built from the blueprints in section 6, plus a Dataslayer connector plan (Starter from $35/mo billed annually), is enough. Move to a full BI or attribution platform only at $5M+ ARR.
1. Why Shopify reporting is broken by default
Four forces have quietly broken the Shopify reporting stack most teams built between 2020 and 2023. If your dashboard still looks like a Shopify Analytics screenshot next to a Meta Ads Manager export, your numbers are misleading by default.
Native Shopify Analytics limitations
Shopify Analytics is excellent at what it does: orders, sessions, conversion rate, average order value, sales by channel inside Shopify. It is the ground truth for revenue actually processed. What it does not do is reconcile with what Meta, Google, or TikTok report they generated. According to the Shopify Help Center analytics documentation, most reports are built around orders and sessions native to the Shopify domain, not around external ad-platform attribution windows. That gap is the whole reason cross-channel dashboards exist.
The GA4 ecommerce gap: sessions vs. orders
GA4 counts events and sessions. Shopify counts orders. Different denominators, different answers. Google's GA4 ecommerce reporting documentation is clear that "purchase" events are hit-level records aggregated by session, which means a returning customer completing a delayed purchase can show up in a different attribution bucket than Shopify's order record for the same transaction. For revenue KPIs, Shopify wins. For pre-purchase funnel behavior, GA4 wins. Picking one and calling it truth is where most reporting stacks go wrong.
Cross-channel silos: everyone self-reports, no one reconciles
Meta, Google, and TikTok each claim credit for the same orders. When you add up the revenue self-reported by every ad platform running against a mid-sized Shopify store, the sum routinely exceeds actual Shopify revenue by a wide margin, a pattern documented in public ecommerce reporting benchmarks and confirmed by Meta itself: their Business Help Center attribution docs spell out that its models are self-reported and probabilistic. TikTok and Google use different attribution windows again, compounding the overclaim. Our full framework for reconciling ad-platform revenue with Shopify orders lives in the cross-platform ad spend tracking guide.
Retention and acquisition live in different tools
Klaviyo owns retention (flows, email revenue, repeat purchase). Ad platforms own acquisition. Shopify owns the order. No default report unifies them. Most Shopify dashboards you have seen are acquisition-only, which is why the same store can look profitable on Meta and unprofitable on the P&L. Retention KPIs (LTV by channel, repeat purchase rate) belong on the same dashboard as ROAS. Our Klaviyo to Looker Studio guide covers the email side of that view.

2. The Shopify data model: what you can actually track
Before you design a dashboard, you have to know which fields Shopify exposes, which fields GA4 adds on top, and which fields only appear if you pull them from the Shopify API directly. Most Shopify reports built on native templates leave attribution fields on the table because the person building the dashboard did not know they existed.
Native Shopify Analytics: what it captures
Native reports cover total sales, orders, sessions by source, conversion rate, average order value, discounts applied, and channel mix (online store, POS, wholesale). They refresh in near real time and are usable for weekly ops without any setup. The gap is customization: no cohort LTV by default, no reconciled ROAS, no attribution windows aligned with ad platforms, no cross-channel deduplication.
Metrics available via the Shopify API
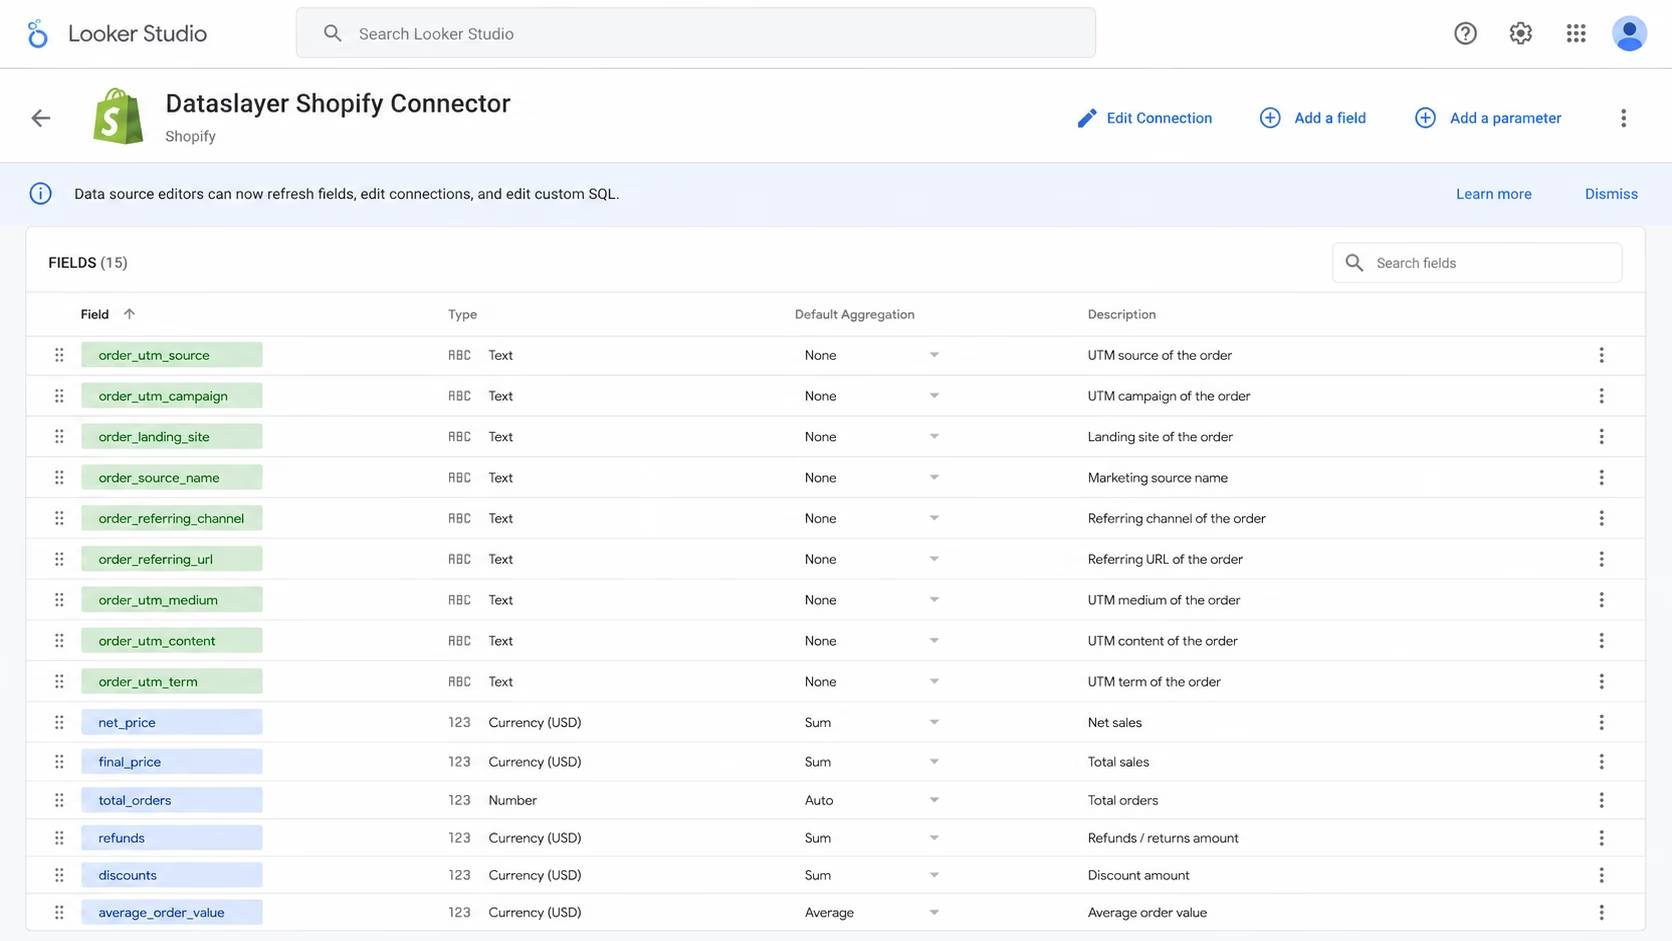
The Shopify GraphQL Admin API exposes order-level fields that never make it into the default report UI. Dataslayer normalizes them into friendly IDs available in Looker Studio: order_utm_source, order_utm_campaign, order_utm_medium (attribution touchpoints per order), order_landing_site (first URL touched), order_source_name (sales channel), order_referring_channel, and order_referring_url. These are the fields that let you build channel-attributed KPIs against actual orders, not against ad-platform self-reports.
Order-level fields mapped to dashboard KPIs
For teams already exporting to Sheets as a bridge, our how to connect Shopify to Google Sheets guide walks through pulling these same fields into a spreadsheet before you graduate to Looker Studio.
3. Reporting stack architecture: where your Shopify data should live
There is no single right answer for where Shopify data belongs. The right destination depends on store revenue, team maturity, and how many other channels you need in the same view. The table below is the framework to pick a stack that will not need a rebuild in six months.
A quick read on the vendors in that last row (pricing verified July 2026, all figures in USD). Databox offers a free tier, with paid plans starting at $159/mo (Pro) on its pricing page. Klipfolio's Klips product starts at $120/mo billed annually (Klipfolio pricing). Polar Analytics does not publish pricing publicly; plans are enterprise-tier and quoted on request via Polar pricing. Peel Insights is enterprise-only and quoted per store, typically in the four-figure range per month. All are excellent products. None are necessary for a Shopify store under $5M ARR that can run Looker Studio with a connector layer instead.
GA4 plus Looker Studio: the free hybrid
If you already run GA4 on your Shopify store, you can build a basic dashboard for free by pulling GA4's ecommerce dataset into Looker Studio via the native connector. It works for session-based funnel analysis. It falls apart the moment you need order-level revenue reconciled with ad spend, because GA4's revenue field does not match Shopify's order table for the reasons covered in section 1.
Dataslayer plus Looker Studio: the sweet spot
Dataslayer sits between "free GA4 setup" and "expensive BI vendor". It connects Shopify, Meta Ads, Google Ads, TikTok Ads, LinkedIn Ads, Klaviyo, Search Console, and 50+ other sources directly into Looker Studio, Google Sheets, Excel, Power BI (core destinations, unlimited rows on paid plans), or into BigQuery, Snowflake, and other enterprise warehouses (row limits scale by plan). Transparent tiered pricing, no per-row billing on core destinations, which is why teams switch from Supermetrics (per-row) or Databox (per-user). Our Supermetrics alternatives comparison covers the pricing model differences in detail.
"Incredibly useful for lining up events and conversions between Shopify, Meta Ads, and GA4."
Verified Dataslayer customer, G2 review (4.8/5 average across 295 reviews as of July 2026)
BigQuery for advanced use cases
Once you cross about $5M ARR or start attribution modeling, Looker Studio's row limits and the lack of persistent SQL become friction. Dataslayer streams Shopify (and everything else) into BigQuery, Snowflake, Amazon Redshift, or Amazon S3, which then feed Looker Studio or any BI tool downstream. Row limits on enterprise destinations scale by plan (5K on Starter, 100K on Advanced, 2M on Pro, custom on Business). The marketing data warehouse guide covers when the jump is worth it.
When to skip BI vendors (and when they earn their price)
Databox, Klipfolio, Polar, and Peel are worth their pricing when you need their prebuilt dashboards, benchmark data, or ecommerce-specific features (Polar and Peel both offer cohort LTV out of the box). For a store below $5M ARR that just needs a unified reporting view, the Dataslayer + Looker Studio stack does the same job for a fraction of the price and keeps the dashboard layer in a tool you already know.
4. Step-by-step setup: connecting Shopify to Looker Studio
This is the section where the reporting stack becomes real. Below is the exact flow from a fresh Shopify store to a live Looker Studio dashboard with Meta, Google, and TikTok layered in.
Shopify to Google Sheets: the entry option
If your team lives in spreadsheets, start there. A weekly Shopify export into a shared Google Sheet is fine at low volume and gives ops a familiar surface. The Shopify to Google Sheets tutorial covers the full setup. It stops being enough when row counts pass roughly 500K, when the sheet breaks under formula load, or when you need a visual dashboard for stakeholders who do not open spreadsheets.
Shopify to Looker Studio via Dataslayer: the recommended path
Four steps, roughly ten minutes.
- Connect Shopify in your Dataslayer Data Sources Hub. Sign in at app.dataslayer.ai, open the Data Sources Hub, search for Shopify, and complete the OAuth flow to authenticate your store. This is the persistent connection Looker Studio will read from later.
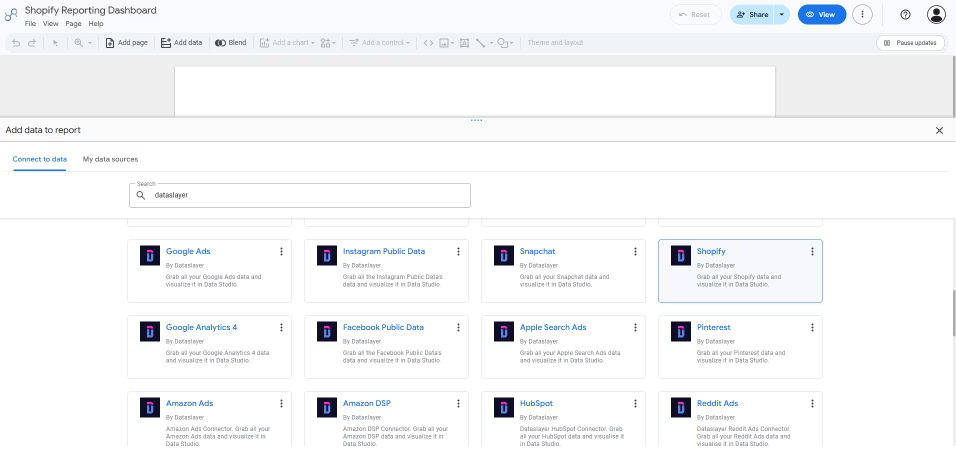
- Open Looker Studio and start a new report. Sign in to Looker Studio, create a blank report, and click "Add data" in the toolbar to open the connector picker.
- Add the Dataslayer Shopify connector. Search "dataslayer" in the community connectors gallery, pick the Shopify connector, and click "Authorize" to grant Looker Studio access. This is a one-time standard Looker Studio OAuth prompt.
- Select your Shopify account and build the report. The store you authenticated in step 1 appears as a selectable account. Click Next, pick the account, adjust the field selection and any filters, then add the connector to the report. From here, follow one of the five dashboard blueprints in section 6 to lay out the KPIs. If you want a head start on the visualization pattern, clone a Google Ads or Meta Ads template from the Dataslayer template gallery and layer your Shopify data source into it.
Adding Meta, Google Ads, and TikTok to the same dashboard
The differentiator is unifying paid platforms next to Shopify orders in one view. Dataslayer treats each platform as another data source in the same account, joined on date and UTM. Repeat the four-step flow above for Meta Ads (Meta Ads to Looker Studio guide), Google Ads, and TikTok Ads. The connector auto-normalizes campaign, ad set, and ad-level dimensions across platforms so your dashboard's channel filter actually works. For the cross-channel dashboard blueprint, our multi-channel attribution dashboard guide shows the same pattern applied to ten platforms at once.
Data model tips: dimensions, timezone, currency, refunds
Four gotchas trip up almost every first-time build.
- Common dimension. Align every source on
dateplus achannelfield derived from the UTM. Shopify exposes it throughorder_utm_sourceandorder_utm_medium, ad platforms via campaign metadata. Normalize in the connector, not in Looker Studio calculated fields. - Timezone. Shopify orders default to UTC. Meta, Google, and TikTok report in the ad account's local timezone. If you do not normalize, you will see phantom mismatches at day boundaries.
- Currency. Shopify records in shop currency. Ad platforms report in the ad account currency. Convert at the connector layer to avoid rate-drift bugs.
- Refunds. Subtract refunds from revenue before calculating ROAS. Most default dashboards ignore this and materially overstate ROAS, especially in verticals with high return rates.
Build your Shopify dashboard in Looker Studio
Connect Shopify, Meta Ads, Google Ads, and TikTok Ads to Looker Studio in under 15 minutes. Follow the blueprints below, or start from a Google Ads/Meta template in the gallery and layer in Shopify data. 15-day free trial, no credit card required.
Try Dataslayer Free
5. The Shopify dashboard KPIs that matter in 2026
Most Shopify dashboards track 25+ metrics. The problem is not that those metrics are wrong, the problem is that they do not drive decisions. Below are the 12 KPIs that matter most for Shopify reporting in 2026, grouped into five buckets that map to how ecommerce teams actually run the business.
Revenue KPIs (1-3)
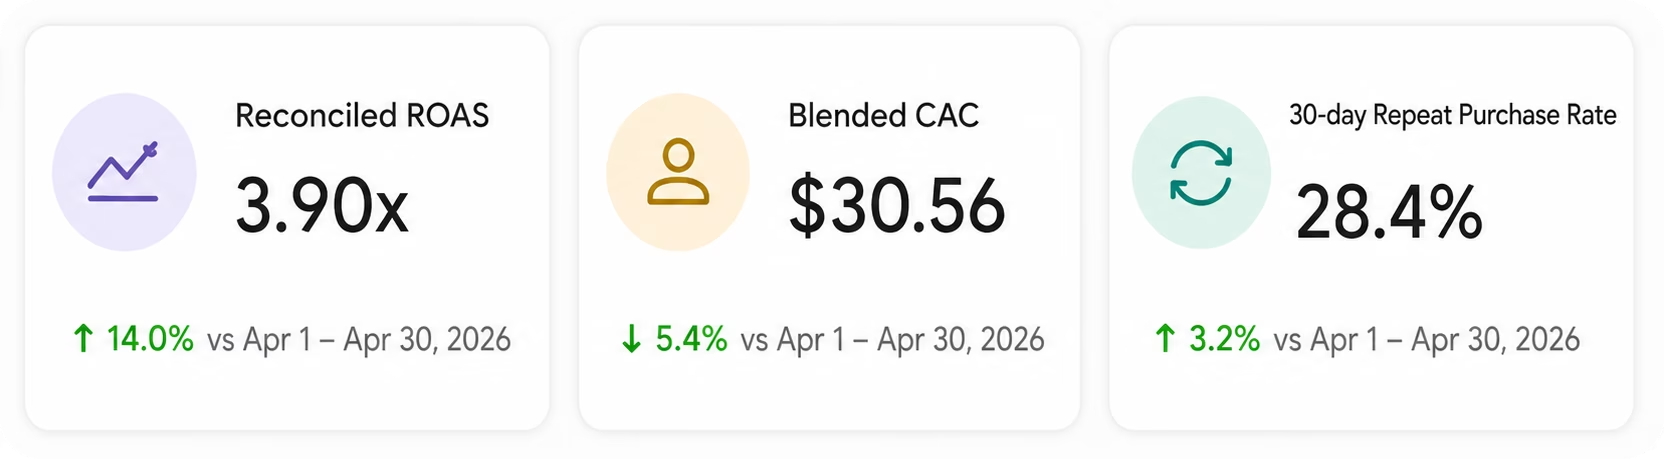
Reconciled ROAS is the anchor. It answers "for every dollar of ad spend, how many dollars did Shopify process?" Net revenue subtracts refunds and discounts, giving CFOs a number they can defend in a board meeting. AOV by channel is the diagnostic underneath, since a 3.5:1 ROAS on TikTok with $28 AOV is a different business than 3.5:1 on Google Search with $118 AOV. Public benchmark reference: LittleData's Shopify benchmarks and the Adobe Digital Economy Index.
Acquisition KPIs (4-6)
New-customer CAC (not blended CPO) is the number that tells you if your paid engine can scale. Attribution mismatch % is the number that tells you how much to trust each platform's self-report. Blended CAC is what your board tracks and is the least game-able of the three. The first-conversion vs all-conversions guide covers why platform CAC is almost always understated.
Retention KPIs (7-8): the ones most Shopify dashboards miss
Repeat purchase rate at 30/60/90 days and LTV by first-touch channel change how you allocate budget. A channel with a 1.8 first-order ROAS but a 3.2 LTV ratio at 90 days is often a better investment than a 3.5 first-order ROAS channel with no repeat behavior. Most Shopify dashboards omit these because Klaviyo (or the CRM) owns the data. That is the exact reason to unify them in Looker Studio. Our Klaviyo to Looker Studio guide covers the pipe.
Funnel KPIs (9-10)
The two conversion rates that split the funnel diagnose different problems. Low add-to-cart to checkout usually points at price, shipping, or trust signals. Low checkout to purchase usually points at payment method availability, form friction, or fraud checks blocking legitimate orders.
Post-purchase KPIs (11-12)
Abandoned-cart recovery revenue is where Klaviyo pays for itself. Refund rate over 5% is a product-market fit warning most dashboards do not surface. Refund rate over 12% typically signals a specific SKU problem worth an ops investigation.
For a wider framework of KPI selection across dashboards, see the marketing dashboard KPIs 2026 playbook.
6. Five Shopify dashboard blueprints for Looker Studio
Rather than describe a template abstractly, here are five opinionated blueprints you can build in Looker Studio using the setup from section 4 and the KPIs from section 5. Each maps to a specific audience (ops team, executive, retention lead), calls out the exact data sources to connect via Dataslayer, and typically takes under an hour to assemble once the connectors are live. Start with #1, then layer in the others as your team's reporting needs mature.
Blueprint #1: Cross-channel Shopify dashboard
Data sources: Shopify + Meta Ads + Google Ads + TikTok Ads.
KPIs: Reconciled ROAS (Shopify final_price by order_utm_source divided by ad spend by channel), blended CAC (total ad spend divided by new_customer_order), attribution mismatch %, LTV by first-touch channel (customer_amount_spent grouped by order_utm_source).
Use case: weekly acquisition-team ops review. Start here if you run paid on three or more platforms. Adjacent building blocks (Google Ads overview, Meta Ads efficiency, TikTok campaign performance) live in the Dataslayer template gallery and can be pulled into the same Looker Studio report as reference tiles.
Blueprint #2: Executive Shopify dashboard
Data sources: Shopify + Meta Ads + Google Ads.
KPIs: Net revenue (Shopify net_price, which already subtracts discounts and returns), blended CAC (total ad spend divided by new_customer_order), returning customer rate (customer_returning_rate), MoM growth (calculated field on net_price).
Use case: monthly board-deck slide, single view. Build it as a one-page Looker Studio report with four scorecard tiles and one MoM trend chart. Refresh weekly, screenshot for the deck.
Blueprint #3: Daily ops Shopify dashboard
Data sources: Shopify (core), GA4 for checkout funnel, Klaviyo for abandoned cart recovery, optional inventory feed via Google Sheets.
KPIs: Orders today, AOV, refund rate (all from Shopify), checkout completion rate (GA4 checkouts metric divided by sessions), abandoned-cart recovery revenue (Klaviyo attributed to the Abandoned Cart flow).
Use case: daily standup for ops and CX. Single-page report with today's totals up top, 7-day trend underneath, and an inventory-low list at the bottom if you feed SKU data in from a Google Sheet.
Blueprint #4: Retention and LTV Shopify dashboard
Data sources: Shopify + Klaviyo.
KPIs: Returning customer rate (Shopify customer_returning_rate), LTV cohort by first-touch channel (customer_amount_spent grouped by order_utm_source), abandoned-cart recovery revenue (Klaviyo filtered on Attributed Flow name = "Abandoned Cart"), email revenue attribution by flow (Klaviyo group_by_attr_flow_name).
Use case: quarterly retention review, informs email spend and lifecycle strategy. Split the report into three sections: cohort table (rows are acquisition month, columns are Shopify returning customer rate windows filtered by date range), LTV by channel bar chart, and Klaviyo flow revenue breakdown. For 30/60/90-day repeat windows, apply a custom date range filter on each tile rather than relying on a built-in bucket.
Blueprint #5: Ad-attribution light Shopify dashboard
Data sources: Shopify + Meta Ads + Google Ads.
KPIs: Reconciled ROAS by campaign, attribution mismatch %, CAC by campaign, platform-reported vs Shopify-order-attributed revenue by campaign.
Use case: paid-media weekly QA. Two side-by-side tables at campaign granularity, one showing platform-reported revenue and one showing Shopify-order-attributed revenue (joined on order_utm_campaign). Filter by date range and channel to spot the widest overclaim campaigns. For a true first-vs-last-click comparison, layer GA4 with different attribution models applied.
Blueprint #5 is deliberately light on attribution modeling. For a full multi-model reconciliation (last-click, position-based, data-driven), see our September 2026 pillar on Shopify attribution: reconciling orders with Meta, Google, and TikTok ad spend. Broader inspiration lives in the 10 free Looker Studio templates roundup and the guide to Looker Studio templates.
7. Common mistakes and how to avoid them
Seven mistakes make up the majority of broken Shopify dashboards we see when helping customers audit their reporting stacks. Each has an impact estimate (typical ranges seen in ecommerce reporting) and a concrete fix.
- Trusting Meta 7-day-click as ground truth. Impact: material ROAS overstatement, often into the tens of percent. Fix: reconcile against Shopify orders using order-level UTM, not Pixel events.
- Ignoring UTMs on organic and email traffic. Impact: unattributed revenue lumps into "direct" and inflates its share significantly. Fix: enforce UTM discipline across every outbound link, including Klaviyo flows.
- Reconciling with GA4 sessions instead of Shopify orders. Impact: notable variance between session-based and order-based math. Fix: use Shopify as the source of truth for revenue KPIs; use GA4 only for pre-purchase funnel.
- Building the dashboard once and never refreshing attribution windows. Meta, Google, and TikTok have all revised default attribution windows multiple times since 2024, and more changes are expected during 2026. Fix: run a quarterly attribution review, verifying current defaults at each platform's help center (Meta, Google Ads, TikTok Ads) before every reporting cycle.
- Skipping refund and cancellation reconciliation. Impact: refund and cancellation rates vary widely by vertical (apparel and consumer electronics tend to be highest). Dashboards showing gross revenue only inflate ROAS. Fix: subtract refunds inside the KPI formulas.
- Missing retention KPIs entirely. Most Shopify dashboards are acquisition-only. Repeat purchase rate and LTV by channel change strategic decisions. Fix: add the retention bucket from section 5.
- Using GA4 default channel groupings without customization. GA4 lumps Meta and Google under "Paid Search" for some campaigns and under "Cross-network" for others, breaking cross-channel comparisons. Fix: custom channel grouping in GA4 or use the Dataslayer channel dimension. See our GA4 attribution models limitations breakdown.
Mistake #4 is the source of most "my Shopify dashboard reporting is not accurate" complaints. If the last attribution refresh was more than one quarter ago, the numbers are stale by definition. The refresh is a one-hour job. Do it.
8. When you need more than reporting: the attribution segue
Reporting describes what happened. Attribution models why it happened. This pillar covers the first job. When you outgrow it, the second job is the next step, and the two are not the same tool. Use the decision framework below to know when to move.
For the deep dive on reconciling Meta, Google, and TikTok reported revenue against Shopify orders with attribution models compared, see our September 2026 pillar: Shopify attribution: how to reconcile orders with ad spend. Broader context in the marketing attribution broken in 2026 pillar and the ad spend tracking across platforms guide.
9. Frequently asked questions
What is the best Shopify reporting dashboard for a small store? For stores under $500K ARR, Shopify's native Analytics is enough for basic revenue KPIs. Add a Dataslayer plus Looker Studio setup when you start running paid ads across multiple channels and need reconciled ROAS.
Can I build a Shopify dashboard in Looker Studio without paying for a BI tool? Yes. Dataslayer's Shopify plus Meta, Google, and TikTok connectors feed Looker Studio from $35/mo (Starter, billed annually), which is cheaper than Databox (paid tier from $159/mo), Klipfolio Klips ($120/mo billed annually), or Polar Analytics (enterprise-tier, contact for quote). See section 3 for the stack comparison.
How do I connect Shopify to Google Looker Studio? Two steps: (1) connect your Shopify store in the Dataslayer Data Sources Hub at app.dataslayer.ai via OAuth; (2) in Looker Studio, click Add data, search "dataslayer", pick the Shopify connector, authorize it, and select the store you just connected. Section 4 walks through the full flow. No SQL required.
What are the most important Shopify KPIs to track? The 12 KPIs across five buckets in section 5: reconciled ROAS, net revenue, AOV by channel, new-customer CAC, attribution mismatch %, blended CAC, repeat purchase rate, LTV by first-touch channel, add-to-cart to checkout rate, checkout to purchase rate, abandoned-cart recovery revenue, and refund rate.
Why don't my Meta Ads numbers match Shopify? Meta self-reports via Pixel and CAPI using its own attribution windows (defaults have been updated multiple times in recent quarters; verify current settings in Meta's attribution help before configuring). Typical overstatement vs. Shopify actual revenue commonly runs into the tens of percent, especially on retargeting and view-through campaigns. Section 7 covers reconciliation.
What is the difference between Shopify Analytics and Google Analytics 4 for reporting? Shopify Analytics is order-based; GA4 is session and event-based. Different denominators produce different answers. Use Shopify as the source of truth for revenue KPIs, GA4 for pre-purchase funnel analysis. Use both, not one.
Do I need BigQuery for a Shopify reporting dashboard? Not for most stores. Looker Studio direct is enough. Move to BigQuery via Dataslayer when you need more than two years of history, custom attribution modeling, or ML use cases, typically at $5M+ ARR with an analyst on team.
How often should I refresh my Shopify reporting dashboard? Quarterly for attribution window changes (Meta, TikTok, Google), monthly for KPI framework review, weekly for ops metrics. Set a calendar reminder for each cadence.
10. Wrapping up
Shopify reporting in 2026 needs three things the 2020 playbook did not: order-level reconciliation with ad platforms, retention KPIs on the same view as acquisition, and quarterly refreshes tied to platform attribution changes. Cut your KPI list to the 12 above, put them in a Looker Studio dashboard built from the blueprints in section 6, feed it from Shopify via a connector, and hold off on a full BI platform investment until you cross $5M ARR.
Connect Shopify to Looker Studio in 5 minutes
50+ data sources including Shopify, Meta Ads, Google Ads, TikTok Ads, Klaviyo. Unlimited rows on core destinations (Sheets, Excel, Looker Studio, Power BI), transparent tiered pricing, 15-day free trial.
Start Free Trial


