


TL;DR: Add the Dataslayer Meta Ads Community Connector inside Looker Studio in under 10 minutes (three entry points below), then build three Meta-specific dashboards the native Ads Manager handles poorly: Pixel vs. Conversions API reconciliation, placement mix (Reels and Stories on their own view), and Advantage+ vs. Manual campaign separation.
Two reporting realities make Meta Ads harder to visualize than any other paid channel in 2026. The first is that Meta's event data lives in two places (browser-side Pixel and server-side Conversions API) and reconciling them inside a dashboard is not a default behavior. The second is that Meta has seven major placements (Facebook Feed, Instagram Feed, Stories, Reels, Audience Network, Messenger, in-stream video) plus Advantage+ campaigns that hide placement allocation behind the AI optimizer. The native Ads Manager flattens both problems into single rows; Looker Studio (rebranded back to Data Studio in 2026, though most marketers still call it Looker Studio) is where they can actually be untangled.
This guide covers how to push Meta Ads data into Looker Studio with Dataslayer in under 10 minutes, then three Meta-specific dashboards that solve reporting problems the native UI does not. Connection first, then the dashboards that justify the work.
How to connect Meta Ads to Looker Studio with Dataslayer
Dataslayer is a Looker Studio Community Connector, so the entire connection happens inside Looker Studio itself. There are three entry points; pick whichever fits your workflow. Total time from logged-in user to a live data source: under 10 minutes.
Entry point 1: from the Dataslayer dashboard. Log in at app.dataslayer.ai with your Google account. Open the Destinations section and click Open Looker Studio. A new Looker Studio document opens with the full list of Dataslayer connectors visible; pick Facebook Ads (this is how the connector is labeled inside Looker Studio; it covers both Facebook and Instagram Ads).
Entry point 2: from the Dataslayer website. Go to dataslayer.ai connectors and select the Facebook Ads connector for Looker Studio. Clicking it opens Looker Studio directly with the connector loaded.
Entry point 3: from inside any Looker Studio dashboard. Click Add data to report, type "Dataslayer" in the connector gallery search, and select the Facebook Ads connector from the results.
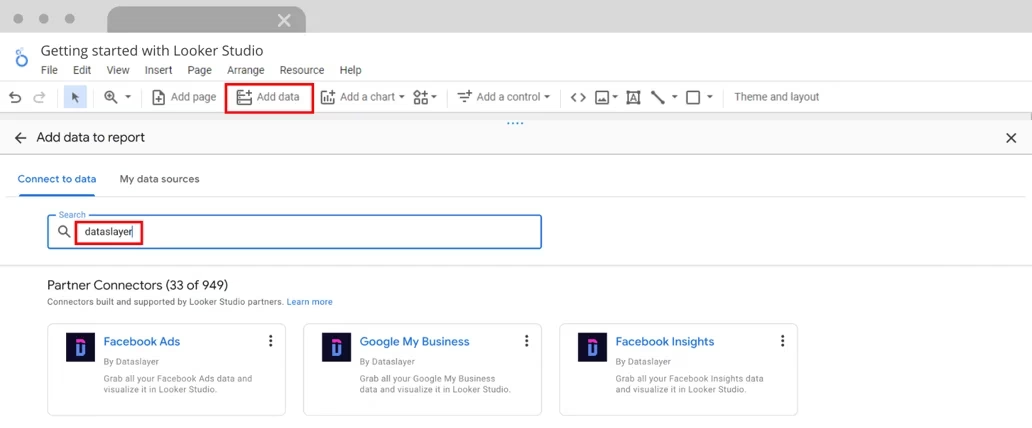
Whichever entry point you use, the next steps inside the Looker Studio connector configuration are the same:
- Authorize Facebook/Meta. The connector configuration screen prompts for OAuth authorization. Sign in with the Facebook/Meta account that has at least Advertiser access to the ad account you want to report on, and grant the requested read permissions.
- Select ad accounts. Choose one or many ad accounts to include in this data source.
- Set optional parameters (or leave defaults). The connector exposes options like attribution window (default: 7-day click, 1-day view), include empty data, date range type, and other Meta-specific toggles. Defaults work for most reporting use cases; tighten them only if you have a specific reason.
- Click Connect. Looker Studio loads the full Meta Ads schema and adds the data source to your report. From there it works like any Looker Studio data source: drag fields onto charts (spend, impressions, conversions, ROAS, frequency, CTR, plus any Custom Conversions), set filters at page level, and share with stakeholders.
You need to be logged into dataslayer.ai for the connector to work. If you have no paid plan, a 15-day free trial activates automatically; after the trial, the account drops to the free tier (no payment details required at any point).
What about the alternatives. Meta does not publish its own first-party Looker Studio connector. Other Community Connectors exist but typically have row caps, throttling, or paid tiers that scale less predictably than Dataslayer's per-usage model. Piping Meta into BigQuery first and then to Looker Studio works for warehouse-first teams but adds storage and query costs plus engineering setup time. For most marketing teams, the Dataslayer Community Connector is the shortest path to a working dashboard. If you also need the same data in a spreadsheet for ad-hoc analysis, see our companion guide on connecting Meta Ads to Google Sheets.
Pixel vs. Conversions API: the reconciliation Meta makes you build yourself
Since iOS 14, Meta has nudged advertisers to send conversion events via the server-side Conversions API (CAPI) in addition to the browser-side Pixel. The result, in 2026, is that most active accounts have two event streams reporting the same conversions: Pixel (which loses signal when users opt out of tracking) and CAPI (which keeps signal but requires backend integration). Meta deduplicates them in Ads Manager using event_id, but the deduplication is opaque, and when the two streams disagree, Ads Manager does not surface the disagreement.
The dashboard to build: a side-by-side reconciliation view.
- Pixel-only conversions vs. CAPI-only conversions over time. A dual-line time series for the last 30 days. CAPI numbers commonly run somewhere in the 10-40% range above Pixel-only after iOS opt-outs (operator-observed range across ecommerce accounts; not a Meta-published figure). If CAPI is consistently above Pixel, the implementation is doing its job. If Pixel is higher, the CAPI integration is dropping events. If both lines diverge after a Meta update, it's an alert.
- Deduplication rate. A single scorecard showing what percentage of events Meta considered duplicates. Many accounts that have implemented
event_idcorrectly observe 60-85% deduplication when both streams send the same events (operator-observed range, not a Meta benchmark). A sudden drop suggests theevent_idimplementation broke. - Event match quality by event type. A bar chart of Meta's Event Match Quality (EMQ) scores for the top 5 conversion events. Meta's EMQ scale runs 0-10, with anything below 6.0 falling into Meta's "Fair" or "Poor" bands, which degrades attribution and Advantage+ performance.
Most accounts run this kind of reconciliation in spreadsheets if at all. Putting it in Looker Studio makes it a passive monitor: anyone who opens the dashboard sees whether CAPI is healthy, without having to remember to check.
Placement mix: why Reels and Stories deserve their own view
Meta's Ads Manager breakdown by placement is technically available, but the default reports collapse Facebook and Instagram into "Meta" and group Stories and Reels with Feed. The behavior, performance, and cost dynamics of each placement are different enough that the aggregation hides real signal. In many ecommerce accounts in 2026, Reels' spend share now outpaces its conversion share, a pattern worth checking in your own data, because the native UI does not flag it.
The dashboard to build: a placement-level deep dive.
- Spend share vs. conversion share by placement. A stacked bar chart with two bars per placement: percentage of total spend, percentage of total conversions. When a placement's spend share exceeds its conversion share by more than 5 percentage points, it's a candidate for budget reallocation. Reels frequently shows this gap in ecommerce accounts.
- CPA delta vs. account average by placement. A horizontal bar chart showing each placement's CPA as a percentage above or below the account average. Audience Network commonly shows lower CPA than Feed placements (magnitude varies widely by account and vertical) but with the trade-off of lower-quality conversion signals, so this metric needs to be read alongside post-conversion data (LTV, retention, refund rate) if available.
- Frequency by placement. Reels and Stories cap frequency naturally (users scroll past quickly); Feed accumulates frequency much faster. A dashboard showing frequency by placement reveals which placements are saturating audience the fastest.
- Creative format performance overlay. A small grid showing which creative format (single image, carousel, video) wins in each placement. The same creative does not perform the same in Feed vs. Reels vs. Stories, and the dashboard makes that visible.
This view is impossible to assemble in Ads Manager without 4-5 separate breakdown reports exported and stitched together. In Looker Studio, it's one tab. For teams that need to extend this view across Meta plus Google Ads, TikTok, LinkedIn, and other channels in the same dashboard, our multi-channel attribution dashboard guide walks through the blending logic. For the Google-side companion tutorial specifically, our Google Ads to Looker Studio guide applies the same connection pattern to PMax and Search campaigns.
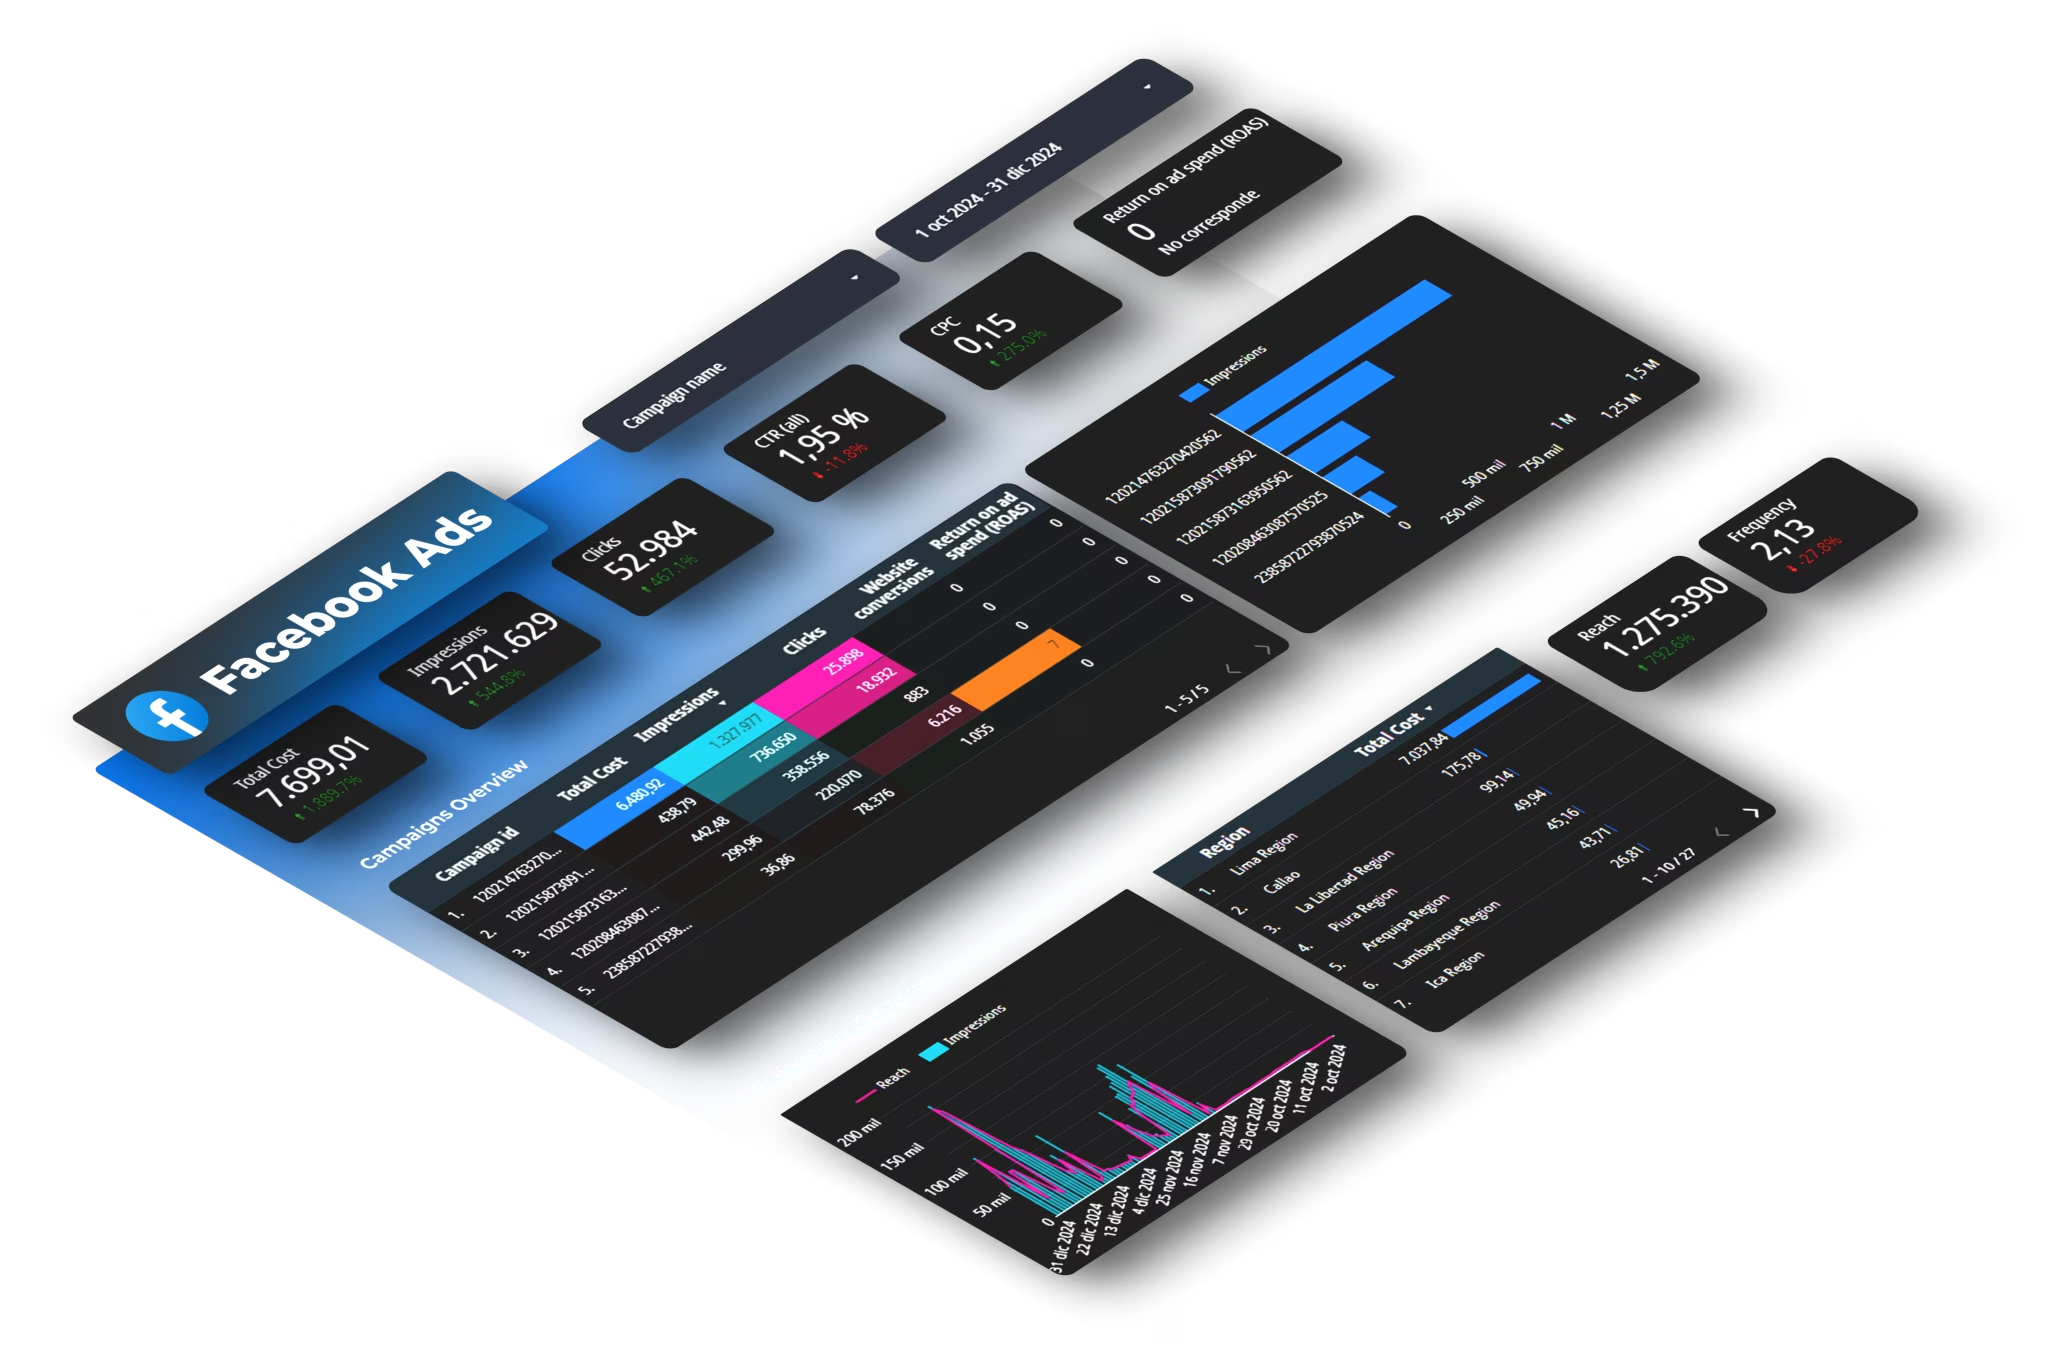
Advantage+ vs. Manual: keeping AAA performance separate from the rest
Advantage+ Shopping Campaigns (and the broader Advantage+ family) are Meta's AI-optimized campaign type, where most targeting and placement decisions are made by the algorithm. By 2026, Advantage+ has grown to a substantial share of Meta spend in many ecommerce accounts (account-level share varies widely). The problem for reporting: Advantage+ campaigns mix into the same account-level metrics as manual campaigns, so account averages are a weighted blend of AAA performance and manual performance, neither of which is interpretable in isolation.
The dashboard to build: a campaign-type segmented view.
- Spend, conversions, ROAS by campaign type. Two columns of scorecards: Advantage+ and Manual, with the same metrics in each. Lets stakeholders see at a glance whether AAA is pulling its weight relative to its share of spend.
- Trend lines split by campaign type. Two stacked time-series: spend over time by campaign type, and ROAS over time by campaign type. Reveals whether the account is becoming more dependent on Advantage+ over time and whether ROAS is converging or diverging.
- Top performers within each type. Two parallel tables (top 5 Advantage+ campaigns, top 5 Manual campaigns) so the optimization meeting can compare apples to apples. Mixing them in a single sorted table produces misleading rankings because Advantage+ campaigns typically have larger budgets.
- Audience overlap and learning phase indicators. A small section showing which Manual campaigns are still in learning phase and which Advantage+ campaigns are pulling from overlapping audiences (Meta exposes this in the Audience Insights tab; surfacing it in the dashboard prevents the common bug of having two campaigns bidding against each other for the same users).
The reason this dashboard matters: optimization decisions made on blended Advantage+/Manual numbers tend to be wrong in both directions (cutting underperforming Manual campaigns that are actually feeding Advantage+ with conversion signal, or scaling Advantage+ without realizing it's overlapping with Manual audiences).
Get Meta into Looker Studio in 10 minutes
Dataslayer connects Meta Ads to Looker Studio with unlimited rows on paid plans (Looker Studio is a core destination), Looker Studio's native scheduled refresh, and the same connector pattern across the rest of your stack. Same connection logic for Google Ads, TikTok, Klaviyo, Stripe, GA4, and 50+ other sources so all three Meta-specific dashboards above can sit alongside the rest of your marketing stack. The same pattern works for Stripe to Looker Studio when you want subscription data next to ad spend.
Try Dataslayer FreeSetup details that are Meta-specific
Six implementation choices that affect Meta data reporting more than they affect other connectors. Get them right at setup; don't discover them later.
- Attribution window: pick once, enforce everywhere. Meta's default attribution window has been 7-day click, 1-day view since 2021 and remains widely used in 2026. Make sure the connector uses the same window as the Ads Manager view you're benchmarking against. Mixing windows is the most common source of "the numbers don't match" tickets from clients.
- Aggregated Event Measurement (AEM) limit. Since iOS 14, each pixel can prioritize only 8 conversion events per domain for iOS-opted-out users (see Meta's Aggregated Event Measurement documentation). Make sure the events you're reporting on are among the prioritized 8. Reporting on a non-prioritized event will show systematically lower numbers for iOS traffic without an obvious cause.
- Custom Conversions: name them in the data source. If the account uses Custom Conversions, expose them with their friendly names in the connector configuration rather than as
event_42or generic IDs. Future-you filtering by "Purchase Complete" instead of "event_42" is a small thing that saves hours over time. - Actions vs. action_values arrays: pick a single definition. Meta's API returns both an
actionsarray (counts of each event type) and anaction_valuesarray (monetary values, when present). Pick which one your dashboard treats as the canonical "conversion" and stick with it. Mixing both in the same dashboard produces double-counting or value-vs-count confusion that is hard to debug later. - Advantage+ Campaign metadata. When pulling campaign-level data, ensure the
campaign_objectivefield is in the schema. This is how you separate Advantage+ Shopping (objective: OUTCOME_SALES) from manual Advantage+ Audience campaigns from old-school Manual campaigns. Without this field, the type-segmented dashboard from section above is impossible. - Refresh after Meta updates. Meta updates attribution and reporting periodically. When that happens, historical numbers can shift retroactively. Add a small text box on each dashboard ("Meta last updated attribution on YYYY-MM-DD; data prior to that date may differ from current numbers") so stakeholders don't panic when an old screenshot doesn't match a fresh export.
FAQ
Does Meta provide a first-party connector for Looker Studio?
No. Meta does not publish an official Looker Studio connector. All paths go through the Meta Marketing API: community connectors (some with row limits), third-party tools like Dataslayer (which on paid plans offers unlimited rows in Looker Studio as a core destination), or a data warehouse intermediate layer like BigQuery.
Why do Pixel and Conversions API numbers differ in my dashboard?
Pixel loses signal when users opt out of browser tracking (iOS 14+, Safari ITP, ad blockers). Conversions API sends server-side events that bypass those blocks. Across ecommerce accounts, CAPI commonly runs somewhere in the 10-40% range above Pixel-only after opt-outs (operator-observed; not a Meta-published figure). Meta deduplicates the two streams using event_id when both send the same event, but the deduplication rate is itself a data quality signal worth tracking.
How do I separate Advantage+ from Manual campaigns in the dashboard?
Pull the campaign_objective field in your data source schema. Advantage+ Shopping uses OUTCOME_SALES; Advantage+ Audience uses different objectives depending on goal. Filter or segment by this field to produce parallel views for Advantage+ and Manual rather than blending them.
What is a healthy CAPI deduplication rate?
Many accounts that have implemented event_id correctly observe 60-85% deduplication when both Pixel and CAPI fire the same events (operator-observed range, not a Meta benchmark). A rate below 30% usually means event_id is not being passed consistently between Pixel and CAPI, which inflates the conversion count Meta reports.
Can I combine Meta Ads data with Google Ads and GA4 in the same Looker Studio dashboard?
Yes. Looker Studio supports blended data sources that join multiple data sources on common dimensions (date is the most common join key). Most third-party connectors normalize platform names into a "source" or "channel" field so a single blended dashboard can show Meta, Google, TikTok, and LinkedIn side by side.
How fresh is the Meta data after a refresh?
Meta conversion data continues to update for up to 7 days for click-attributed events. The bulk stabilizes within 24-48 hours and full 7-day click attribution settles by day 8. Hourly refreshes do not produce materially fresher numbers; daily refresh at a consistent time is the practical sweet spot for most paid social operations.
Conclusion
The three dashboards above (CAPI reconciliation, placement mix, Advantage+ vs. Manual) cover the reporting questions that the native Meta Ads Manager handles poorly in 2026. They are the dashboards an account manager wishes existed by default but has to build.
With Dataslayer's Meta Ads connector, the data path takes 10 minutes. The rest is Looker Studio layout work, which compounds: once the CAPI reconciliation, placement mix, and Advantage+ vs. Manual dashboards exist in a workbook, adding Google Ads, TikTok, or GA4 to the same view takes another connection and reuses the same filters, color palette, and stakeholder-sharing setup.
Start a free Dataslayer trial to connect Meta Ads to Looker Studio in under 10 minutes (no credit card required), with unlimited rows on Looker Studio across all paid plans and access to 50+ other marketing data sources for when your reporting needs to span more than Meta alone.



