

If you've been managing Performance Max campaigns for a while, you know the frustration: you upload your assets and Google's algorithm decides what to show, where, and when. You get aggregate performance data, but no clear signal on which headline drove that spike in conversions last Tuesday or whether the lifestyle images outperform the product shots.
That opacity around creative decisions is one of the most consistent criticisms of PMax since it launched. In January 2026, Google addressed it directly by expanding native A/B testing for assets to all Performance Max campaign types, not just retail, where it had been available since October 2024.
The short version: you can now compare two sets of creative assets inside a single asset group, split traffic between them, and get a statistically valid winner without creating a duplicate campaign or breaking your campaign's learning phase.
How the Feature Works
The experiment divides assets in your asset group into three buckets:
- Control (Set A): Your existing assets, the baseline you're comparing against.
- Treatment (Set B): The new assets you want to test.
- Common assets: Assets not assigned to either group. They continue serving to 100% of traffic alongside both test sets.
You pick a traffic split, typically 50/50, set a duration, and let it run. Google tracks performance for each arm against your campaign's conversion goals and flags the result as statistically significant when there's enough data to draw a conclusion.
The feature is under Experiments → Assets sub-menu inside Google Ads. Full setup instructions are in Google's official documentation. It was first documented by web marketer Dario Zannoni on January 9, 2026, and confirmed live in multiple accounts by February 10.
Why This Matters More Than Google's Asset Ratings
PMax already shows asset performance ratings, Low, Good, and Best, inside asset groups. Those ratings are not an A/B test. They're a relative ranking of how your assets compare to each other within a single pool. Google favors the better-performing assets and shows them more, which sounds useful, but it means the "Low" assets never get a fair trial since they receive less traffic by design.
Native asset experiments change the methodology. Both arms receive defined traffic shares simultaneously, in the same campaign, against the same audiences and conversion goals. You're measuring the same thing at the same time. That's what makes the result actionable.
Before this, the cleanest workaround was running two separate PMax campaigns with different assets. It worked, but it complicated budget management and introduced enough structural differences to muddy the comparison. Google's November 2025 PMax updates already moved in the direction of more advertiser control, with channel reporting and expanded negative keywords, and native asset experiments continue that trend.
How to Set Up a Performance Max Asset A/B Test
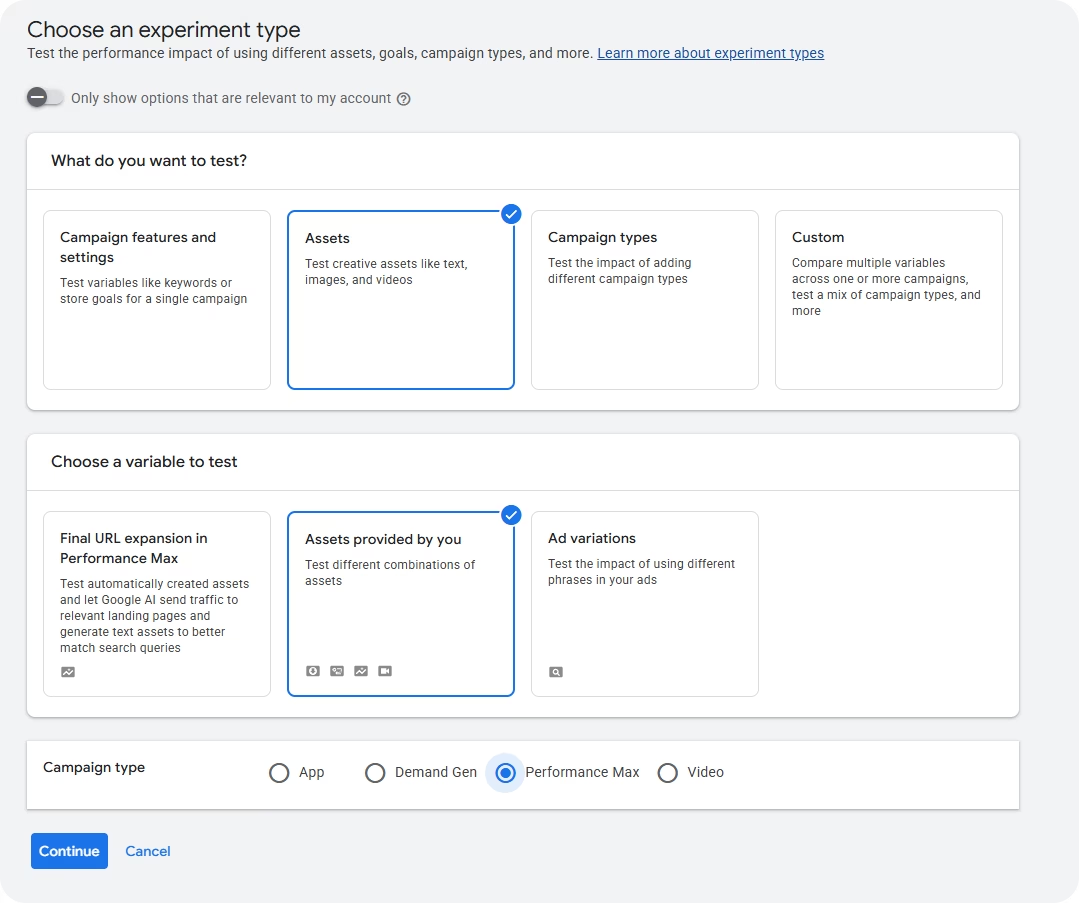
Go to Campaigns → Experiments → All experiments and click the + button. Select Assets as the experiment type, then Assets provided by you. From there: choose the campaign and asset group you want to test, assign assets to the control and treatment arms, set your traffic split, and define a duration.
A 50/50 split is the standard starting point. Go 60/40 if you want to protect more budget on proven assets while still running a valid test.
Check your asset limits before you start. Control and treatment assets both count toward the asset group's maximums: 20 text assets, 20 images, and 15 videos. If your group is close to the limit, remove your lowest-performing assets first or the setup will fail.
What's Worth Testing
The feature is only as useful as your hypothesis. A test between two nearly identical headline sets will produce an inconclusive result every time. Variables that tend to produce meaningful differences:
Messaging angle in headlines. Benefit-led ("Save 3 hours a week on reporting") vs. feature-led ("Connect 50+ platforms in one click"). This usually has the most impact because it affects CTR across all placements and touches the conversion decision directly. Test the angle before you test anything else.
Image style: product vs. lifestyle. Product images on clean backgrounds vs. in-context lifestyle photos perform differently by industry and audience type. Since PMax serves across YouTube, Display, Search, and Discover simultaneously, the winning image style has a wide impact.
Video vs. no video. When no video is uploaded, Google auto-generates one from your other assets. If you don't have strong video assets and have been skipping this, it's worth isolating. The test tells you whether video actually moves performance for your specific campaign before you invest in production.
CTA copy in descriptions. "Start free trial" vs. "See how it works" vs. "Get started today". Small wording differences in description assets drive real conversion rate variation, especially in lead gen where the landing page offer is sensitive to expectation-setting.
Test one variable at a time. If your treatment arm has different headlines, different images, and different videos, you'll get a result you can't act on.
Duration, Results, and When to Call It
The most common mistake is ending experiments too early. Results in the first two or three weeks are almost always noisy. PMax's learning phase needs time to stabilize, and statistical significance takes longer in lower-volume accounts.
When the experiment ends, focus on conversion rate (or conversion value/cost for ecommerce), statistical confidence, and impression distribution between arms. If Google shows overlapping confidence intervals, the result is inconclusive. Both sets performed similarly, which is a valid finding. Don't apply the treatment just because it looks numerically higher.
If the treatment wins, apply it and expect a 1–2 week re-learning period as the algorithm adjusts. If the test is inconclusive, keep the control and come back with a more differentiated hypothesis.
Current Limitations
- One asset group per experiment: If you have 10 asset groups to test at 6 weeks each, you're looking at over a year of sequential testing. Start with the highest-spend group.
- Creatives only: Bidding, audiences, and search themes can't be tested this way.
- Beta rollout: Not all accounts have access yet. If you don't see the Assets option under Experiments, your account is still in the queue.
For other PMax control levers in the meantime, demographic exclusions (available since August 2025) are worth combining with asset experiments to cut wasted impressions while your creative tests run.
The Bottom Line
Native asset experiments don't fix every transparency problem in PMax, but they fix the one that matters most for creative decisions: you can now validate what works with controlled data instead of reading algorithm signals backwards.
The setup takes ten minutes. The harder part is choosing one variable that's actually different enough to move performance, waiting long enough for the result to mean something, and not second-guessing it mid-test.
If your account has access to Performance Max asset A/B testing, start with your highest-spend asset group. If it doesn't yet, use the time to audit your current assets and figure out what you'd actually want to test first.


