


82% of marketers spend 5+ hours weekly on manual reports, according to Meta's research on marketing automation. This marketing reporting guide shows you how to build reports that save time and drive decisions, covering essential metrics, report types, automation strategies, and templates.
What Is Marketing Reporting?
Marketing reporting collects, analyzes, and presents data to measure performance and guide strategy. Effective marketing reporting answers three questions: What happened? Why? What should we do next?
The best reports tell stories. When Google Ads spend jumps 40% but conversions only increase 12%, that's not just data, it's a signal to investigate keyword quality, landing page performance, or audience targeting.
Reports have evolved from static PDFs to interactive dashboards that update automatically. This matters because marketing moves fast. A campaign performing well Monday might crater by Wednesday due to audience fatigue or algorithm changes. Monthly reports catch problems too late.
Why Marketing Reporting Matters in 2026
Marketing budgets face constant scrutiny. Companies with strong reporting practices see 23% higher marketing ROI compared to those relying on gut decisions, according to Google's economic impact research.
Good marketing reporting prevents disasters:
- Budget waste: Catching a Facebook campaign with $8 CPAs instead of the usual $3 before burning another $5,000
- Missed opportunities: Noticing organic traffic from unexpected keywords and creating content to capture more
- Attribution confusion: Understanding which touchpoints drive conversions instead of crediting last-click by default
Most marketing reports fail because they arrive too late, contain too much data, or focus on vanity metrics. Reports that work are specific, timely, and action-oriented.
Types of Marketing Reports You Need
SEO Performance Reports
Track organic visibility and content performance:
- Organic traffic trends (month-over-month, year-over-year)
- Keyword rankings for target terms
- Click-through rates from search results
- Pages driving traffic and conversion paths
- Technical issues affecting crawlability
Example: An e-commerce site noticed 15% traffic drop in October. Their SEO report revealed Google de-indexed 200 product pages due to migration errors. They fixed it within 48 hours instead of losing holiday traffic.
PPC Campaign Reports
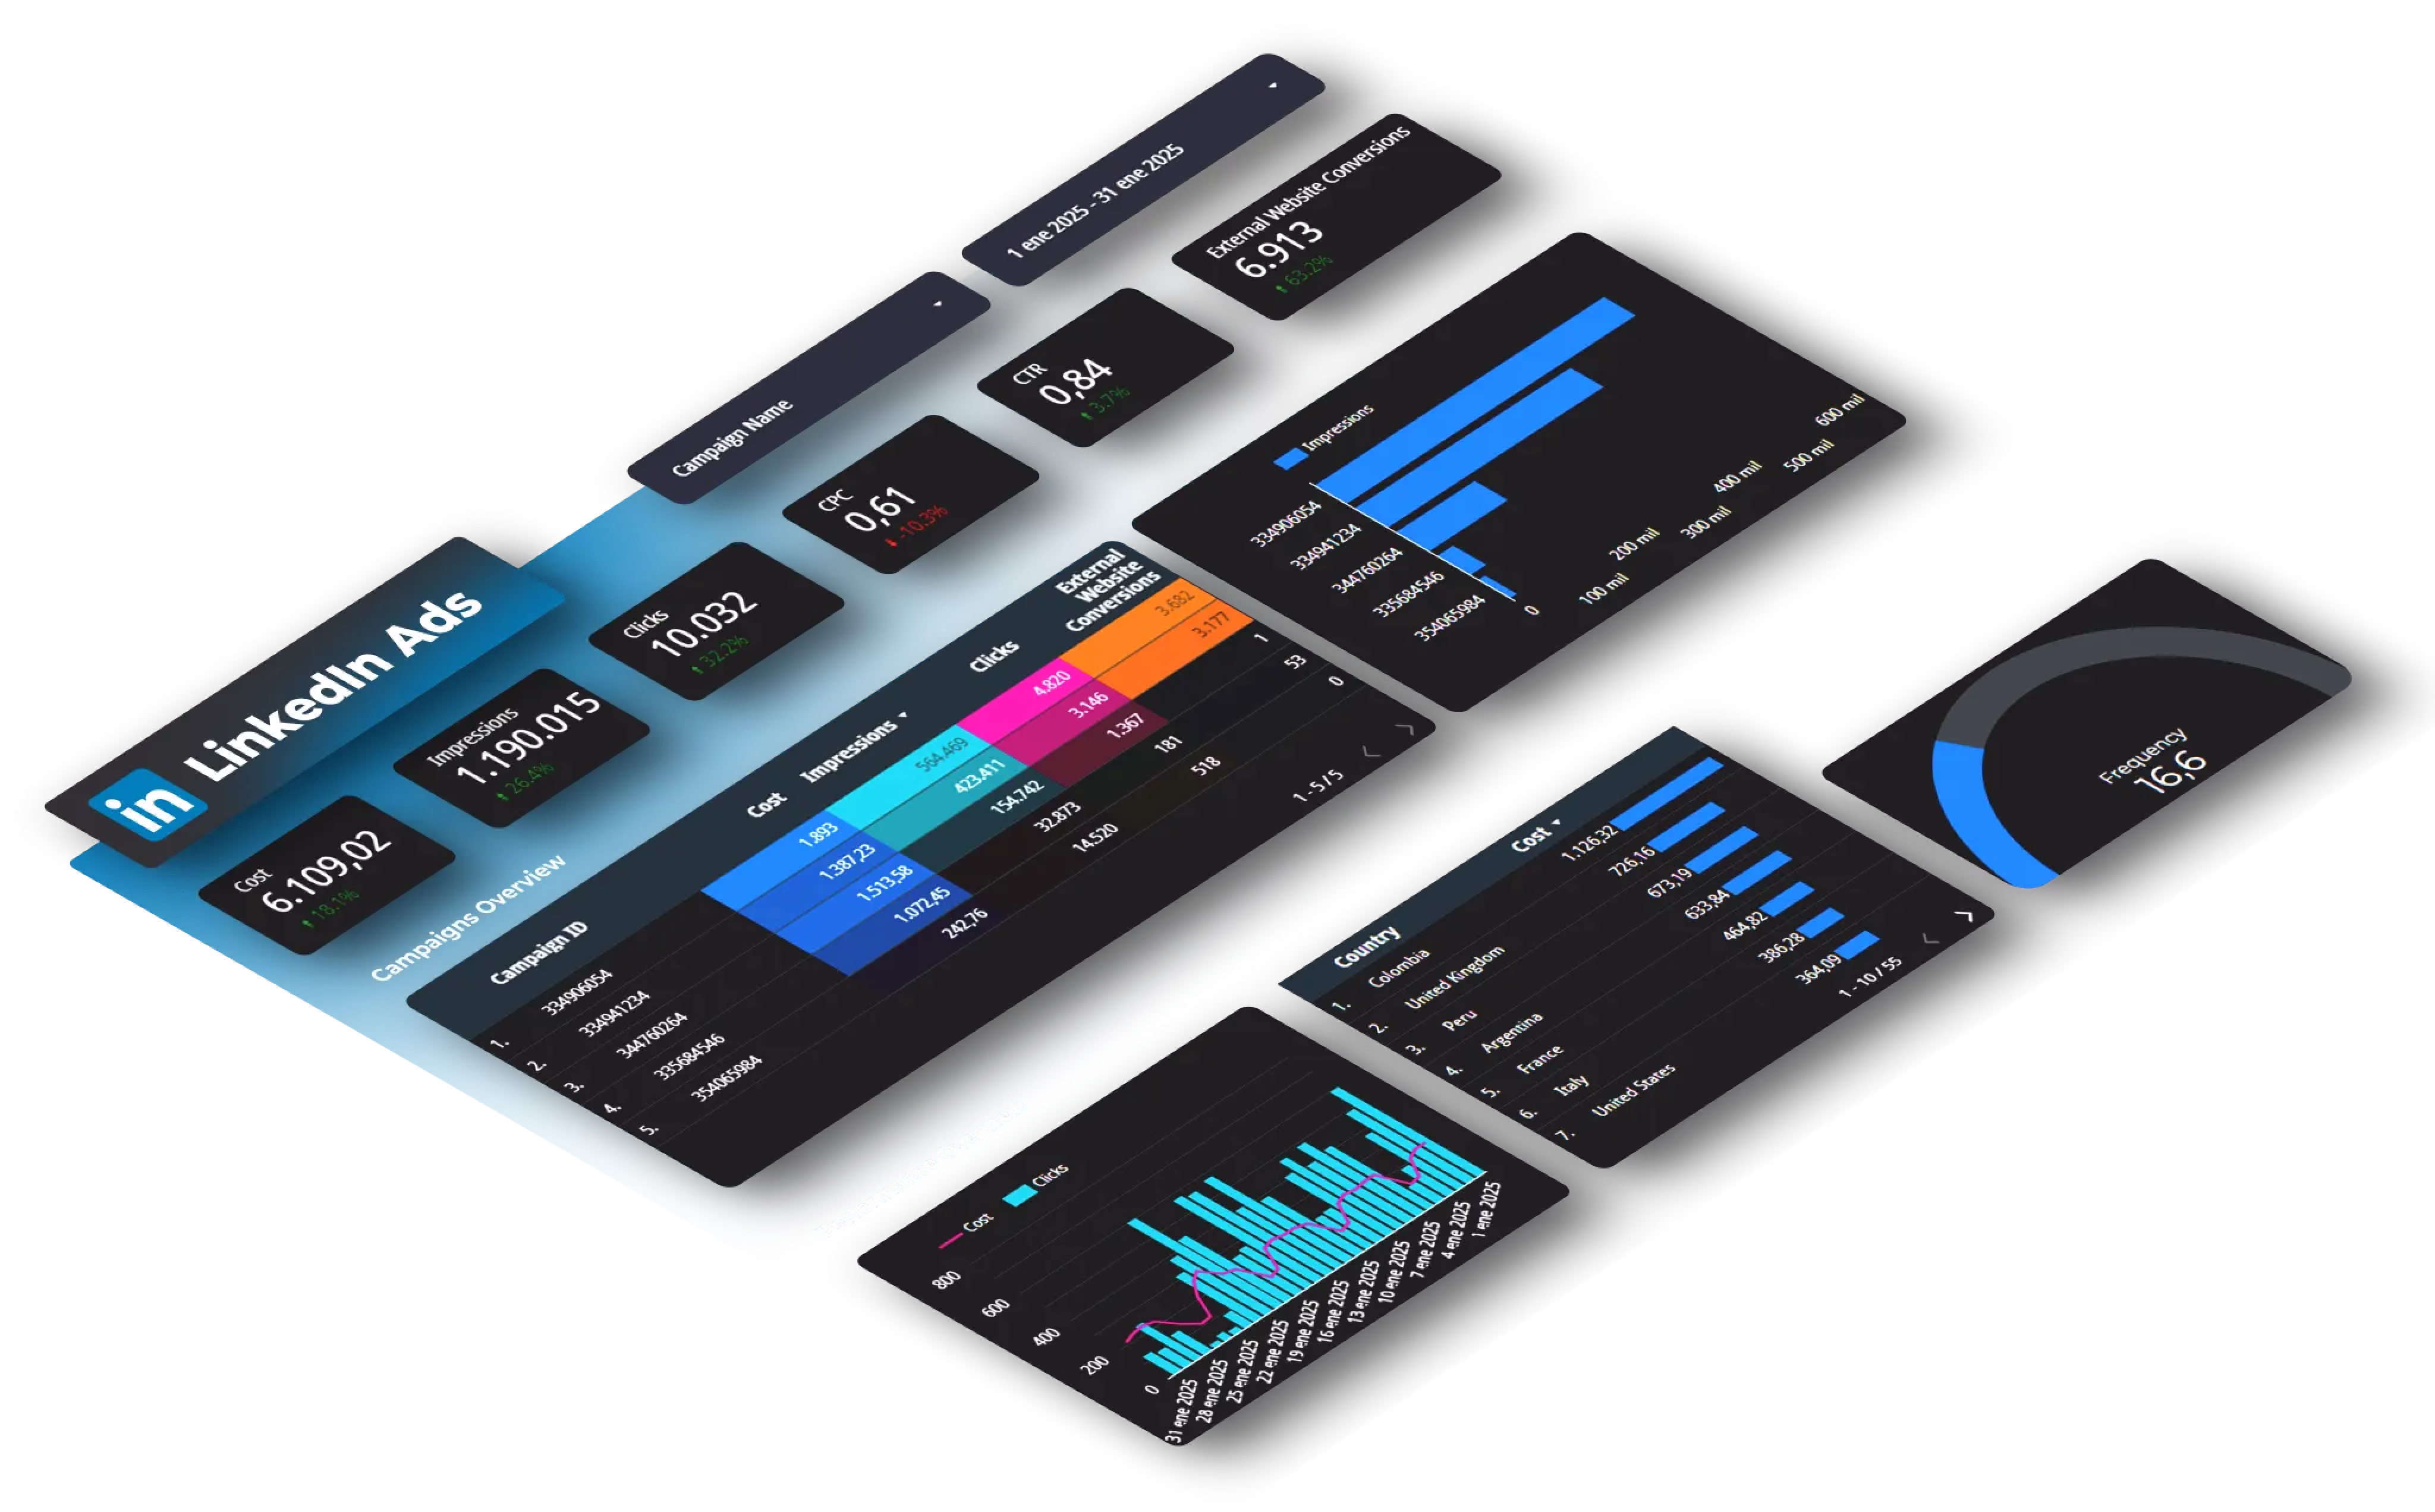
Monitor paid advertising across Google Ads, Meta, LinkedIn, and other channels:
- Spend vs. budget (daily and campaign-level)
- Cost per acquisition by campaign
- Quality Score trends (Google Ads)
- Impression share and lost opportunities
- Hour-of-day and day-of-week patterns
Example: A B2B company's LinkedIn Ads cost-per-lead jumped from $45 to $78. Weekly reporting showed the spike happened when they expanded targeting from IT Directors to all IT professionals, doubling audience size but tripling low-quality leads.
Social Media Reports
Track engagement, reach, and conversion impact:
- Follower growth and demographics
- Engagement rates per post
- Best-performing content by format
- Traffic and conversions from social channels
- Paid vs. organic performance
Example: Analysis of LinkedIn posts in 2025 found document-format posts achieved 40.5% engagement rates compared to 8% for standard posts, completely shifting content strategy for marketers who caught this pattern.
Email Marketing Reports
Measure list health and campaign effectiveness:
- Open rates and click rates by segment
- Conversion rates from email traffic
- List growth and churn
- Deliverability (bounce rates, spam complaints)
- A/B test results
Multi-Channel Attribution Reports
Connect dots across touchpoints:
- Customer journey mapping from first touch to conversion
- Channel contribution using different attribution models
- Assisted conversions vs. last-click credit
- Time to conversion by channel
- Budget allocation recommendations
Example: A SaaS company discovered that while Google Ads got credit for most conversions (last-click), their blog content and LinkedIn ads consistently appeared earlier in buyer journeys. They shifted budget accordingly and saw 31% improvement in conversion rates.
Key Metrics Every Marketing Report Needs
Universal Metrics
- Traffic volume: Segment by channel, device, and new vs. returning. A spike means nothing if it's bot traffic or unqualified audiences.
- Conversion rate: Define what "conversion" means for each campaign (purchase, lead form, signup). Track micro-conversions too, they reveal where the funnel breaks.
- Cost per acquisition (CPA): Total spend divided by conversions. Calculate CPA by channel, campaign, audience, and time period. A $50 average might hide campaigns ranging from $15 to $180.
- Return on ad spend (ROAS): Revenue generated divided by ad spend. E-commerce typically targets 4:1 minimum. B2B might accept 2:1 if customer lifetime value is high.
- Customer lifetime value (CLV): Total revenue a customer generates over their relationship with you. A $500 CPA looks terrible until customers spend $5,000 over three years.
Channel-Specific Metrics
- Paid Search: Quality Score (affects costs), impression share (percentage of possible impressions captured), search term analysis (finding negative keywords)
- Social Media: Engagement rate = (likes + comments + shares) / reach × 100, follower quality, share of voice vs. competitors
- SEO: Featured snippet captures, average position for target keywords, Core Web Vitals scores, backlink quality and growth
- Email: List growth rate, email ROI (revenue per email sent), segment-level performance differences
Avoid Vanity Metrics
- Impressions without context: 100,000 impressions mean nothing if CTR is 0.01% and conversions are zero.
- Total followers: Growing from 10,000 to 15,000 sounds good until engagement dropped from 5% to 2%.
- Bounce rate alone: 75% bounce rate might seem terrible, but for informational content where users get their answer and leave, it's normal.
How to Build Effective Marketing Reports
Start With Questions
Before touching analytics, define what you need to know:
- Is this campaign profitable?
- Which audience segments perform best?
- What's causing the conversion rate drop?
- Should we increase or decrease budget?
Good reports answer specific questions. Bad reports dump every metric into a spreadsheet hoping someone finds something useful.
Choose the Right Format
Live dashboards work for daily monitoring and fast-moving campaigns. They update automatically.
Scheduled reports (weekly, monthly) work for strategic reviews and stakeholder updates. They provide context and recommendations dashboards can't.
Ad-hoc reports answer specific questions: "Why did LinkedIn CPA spike last Tuesday?"
Report Structure
Executive Summary:
- Key metrics with month-over-month changes
- Major wins and problems
- Action items and recommendations
- 2-3 paragraphs maximum
Performance Overview:
- Visual dashboard of main KPIs
- Trend lines showing trajectory
- Comparisons to goals and benchmarks
Channel Deep-Dives:
- Individual channel performance
- Top and worst performers
- Specific opportunities
Analysis and Insights:
- Why metrics changed
- Correlation between actions and results
- Unexpected findings
Recommendations:
- Specific next steps
- Resource requirements
- Expected impact
Use Visualizations Effectively
Line charts show trends over time, perfect for traffic, conversions, or spend patterns.
Bar charts compare performance across channels, campaigns, or time periods.
Tables work for detailed breakdowns when exact numbers matter.
Heat maps reveal patterns, like which days and hours generate most conversions.
Example: A retail brand created a heat map showing conversion rates by hour and day. They discovered conversions peaked Tuesday and Thursday mornings, shifted email sends and ad budgets to match, improving conversion rate by 18%.
Always Include Context
Never show numbers in isolation. "1,847 conversions" means nothing without comparison:
- vs. previous period (up/down X%)
- vs. goal (on track or behind?)
- vs. benchmark (industry average, past performance)
Explain anomalies immediately. If traffic dropped 40% Thursday, add a note: "Google Ads campaign paused due to budget depletion, reactivated Friday."
Show attribution windows. Facebook reports conversions 1-28 days after ad click. Google Analytics typically uses 7 days. Specify which window you're using.
Marketing Reporting Templates and Examples
Basic Marketing Report Template
Section 1: Executive Summary
- Period covered
- Total budget spent
- Total conversions and revenue
- Overall ROI
- Top 3 wins and concerns
Section 2: Traffic Overview
- Total sessions by channel
- New vs. returning visitors
- Top traffic sources
- Device breakdown
Section 3: Channel Performance
- Individual channel metrics
- CPA and ROAS by channel
- Budget pacing
Section 4: Conversion Analysis
- Conversion funnel visualization
- Drop-off points
- Top converting pages/campaigns
Section 5: Recommendations
- Action items with priority levels
- Budget reallocation suggestions
- Test ideas for next period
Advanced Multi-Channel Dashboard
Build dashboards that pull data from multiple platforms. Automation saves 5-10 hours weekly for teams managing multiple channels.
Key components:
- Real-time spend tracking across all platforms
- Unified conversion tracking (using UTM parameters consistently)
- Calculated metrics (overall ROAS, blended CPA)
- Alert thresholds (email when spend exceeds budget or CPA spikes)
Weekly Performance Report Template
Simpler than monthly reports, focused on immediate action:
- Traffic & Conversions: Week-over-week changes, notable spikes or drops
- Campaign Updates: New campaigns launched, paused campaigns, budget adjustments
- Quick Wins: A/B tests completed, optimizations implemented, results from changes
- Action Items: What needs immediate attention, tests to launch this week
How to Automate Marketing Reporting
Why Automation Matters
Manual reporting doesn't scale. Tracking one Google Ads campaign takes 5 minutes. Managing Google Ads, Facebook, LinkedIn, TikTok, email, and SEO, each with multiple campaigns, consumes 10-15 hours weekly.
Automation eliminates:
- Copy-paste errors when moving data between platforms
- Time delays, reports available instantly instead of days later
- Formatting inconsistency
- Version control issues
What Can Be Automated
Data collection: Automatically pull metrics from advertising platforms, analytics tools, and marketing software.
Calculations: Apply formulas consistently, ROAS, CPA, conversion rates, growth percentages.
Visualization: Charts and graphs update automatically as new data arrives.
Distribution: Email reports to stakeholders on schedule or when metrics hit thresholds.
Alerts: Get notified when spend exceeds budget, CPA spikes, or conversions drop.
Automation Options for Marketing Reporting
Platform-native features: Google Analytics can email scheduled reports. Facebook Ads has automated rules. Use these for simple, single-platform needs.
Spreadsheet formulas: If exporting to Google Sheets or Excel, formulas can calculate metrics automatically. Use IMPORTRANGE, QUERY, and VLOOKUP functions to combine data.
API connections: Most marketing platforms offer APIs to pull data programmatically. Requires technical skills but offers maximum flexibility.
Connector tools: When pulling from multiple platforms (Google Ads, Facebook, LinkedIn, TikTok, GA4), automated connectors eliminate manual exports and consolidate data into destinations like Google Sheets, Looker Studio, BigQuery, or Power BI.
Building Your First Automated Report
Step 1: Choose your destination
- Google Sheets for simple reports and quick sharing
- Looker Studio for interactive dashboards
- BigQuery for large-scale data warehousing
- Power BI for enterprise reporting
Step 2: Connect your data sources
- List all platforms you need (Google Ads, Facebook, GA4, etc.)
- Verify you have admin access to each platform
- Check which metrics you need from each source
Step 3: Set up your report structure
- Create tabs/pages for different report sections
- Build calculations and formulas
- Design visualizations
Step 4: Schedule updates
- Daily for active campaigns that need monitoring
- Weekly for performance reviews
- Monthly for strategic planning
Step 5: Add conditional formatting and alerts
- Highlight metrics that exceed thresholds
- Set up email alerts for critical changes
Example: A digital agency managing 25 client accounts reduced reporting time from 20 hours weekly to 2 hours. They automated data collection from Google Ads, Facebook, LinkedIn, and GA4 into client-specific dashboards. The 18 hours saved went to optimization work, resulting in average client ROAS improvement from 3.8:1 to 5.2:1.
Common Marketing Reporting Mistakes
Reporting Too Much Data
The 40-page monthly report no one reads wastes everyone's time. Most stakeholders need 5-10 key metrics, everything else is context.
Test: If you can't explain why each metric matters to business goals, remove it.
Inconsistent Definitions
When sales tracks "leads" differently than marketing, reports become meaningless. One team counts form fills, another requires phone calls, suddenly conversion rates make no sense.
Solution: Document how you define every metric. Create a data dictionary. Make sure everyone uses the same definition.
Ignoring Statistical Significance
Running a test for three days with 50 conversions total, then declaring a winner. Most A/B tests need 100+ conversions per variation to reach statistical significance, according to Google Optimize documentation.
Use online calculators to determine sample sizes before starting tests. Don't stop tests early because one version is "winning", variance is real.
Reporting Lagging Indicators Only
Revenue and conversions show what already happened. Leading indicators predict future performance: traffic trends, email list growth, content engagement.
Include both. Lagging indicators measure success; leading indicators help you see problems before they crater results.
Attribution Oversimplification
Last-click attribution credits the final touchpoint before conversion, ignoring everything that happened before. A customer might discover you through organic search, read three blog posts, click a Facebook ad, ignore it, then return via Google Ads and convert.
Use data-driven or time-decay attribution models when possible. For more on this, see our cross-channel attribution guide.
Forgetting Data Quality
Broken tracking means wrong decisions. Common issues:
- GA4 not capturing all conversions
- UTM parameters inconsistent or missing
- Platform pixels not firing correctly
- Cross-domain tracking broken
- Bot traffic inflating numbers
Audit your tracking quarterly. Check that conversion numbers match reality.
Marketing Reporting Best Practices
Make Reports Scannable
Busy stakeholders won't read paragraphs. Use:
- Bold key numbers: "Conversions increased 34% to 1,847"
- Bullet points to break up text
- Visual hierarchy, important info at the top
- Color coding: Green for good, red for bad (consider colorblind users)
Tell a Story
Data without narrative is just numbers. Good reports explain what happened, why it matters, what caused the change, and what to do next.
Example: "Email conversions dropped 22% (from 156 to 122). Investigation shows deliverability issues started October 15 after switching ESPs. We've contacted the new provider and expect resolution within 48 hours. Recommending a re-send to subscribers who didn't receive last week's campaign."
Compare Across Time Periods
Always show:
- Week-over-week: Catches immediate issues
- Month-over-month: Shows sustained trends
- Year-over-year: Accounts for seasonality
An e-commerce site might see 40% traffic increase in December, but if last December was 55% higher, they're actually underperforming.
Set Up Alerts
Don't wait for scheduled reports to catch problems. Set alerts for:
- Daily spend exceeding budget by 20%
- CPA increasing by 50% or more
- Conversion rate dropping below threshold
- Traffic declining by 30%+ day-over-day
Example: An alert notified a manager that their Google Ads campaign spent $2,400 in 6 hours, 300% of daily budget. They caught a bidding strategy error that would have burned $15,000+ by the next day's report.
Document Everything
Campaign naming conventions: Use consistent structures like {channel}_{campaign-type}_{audience}_{date} so reports group related campaigns.
UTM parameters: Create a UTM tagging guide so everyone builds tracking URLs the same way.
Metric definitions: Write down exactly how you calculate each metric.
Change logs: Document when you change tracking, attribution models, or reporting methods, otherwise month-over-month comparisons break.
Marketing Reporting Tools and Software
Native Platform Reporting
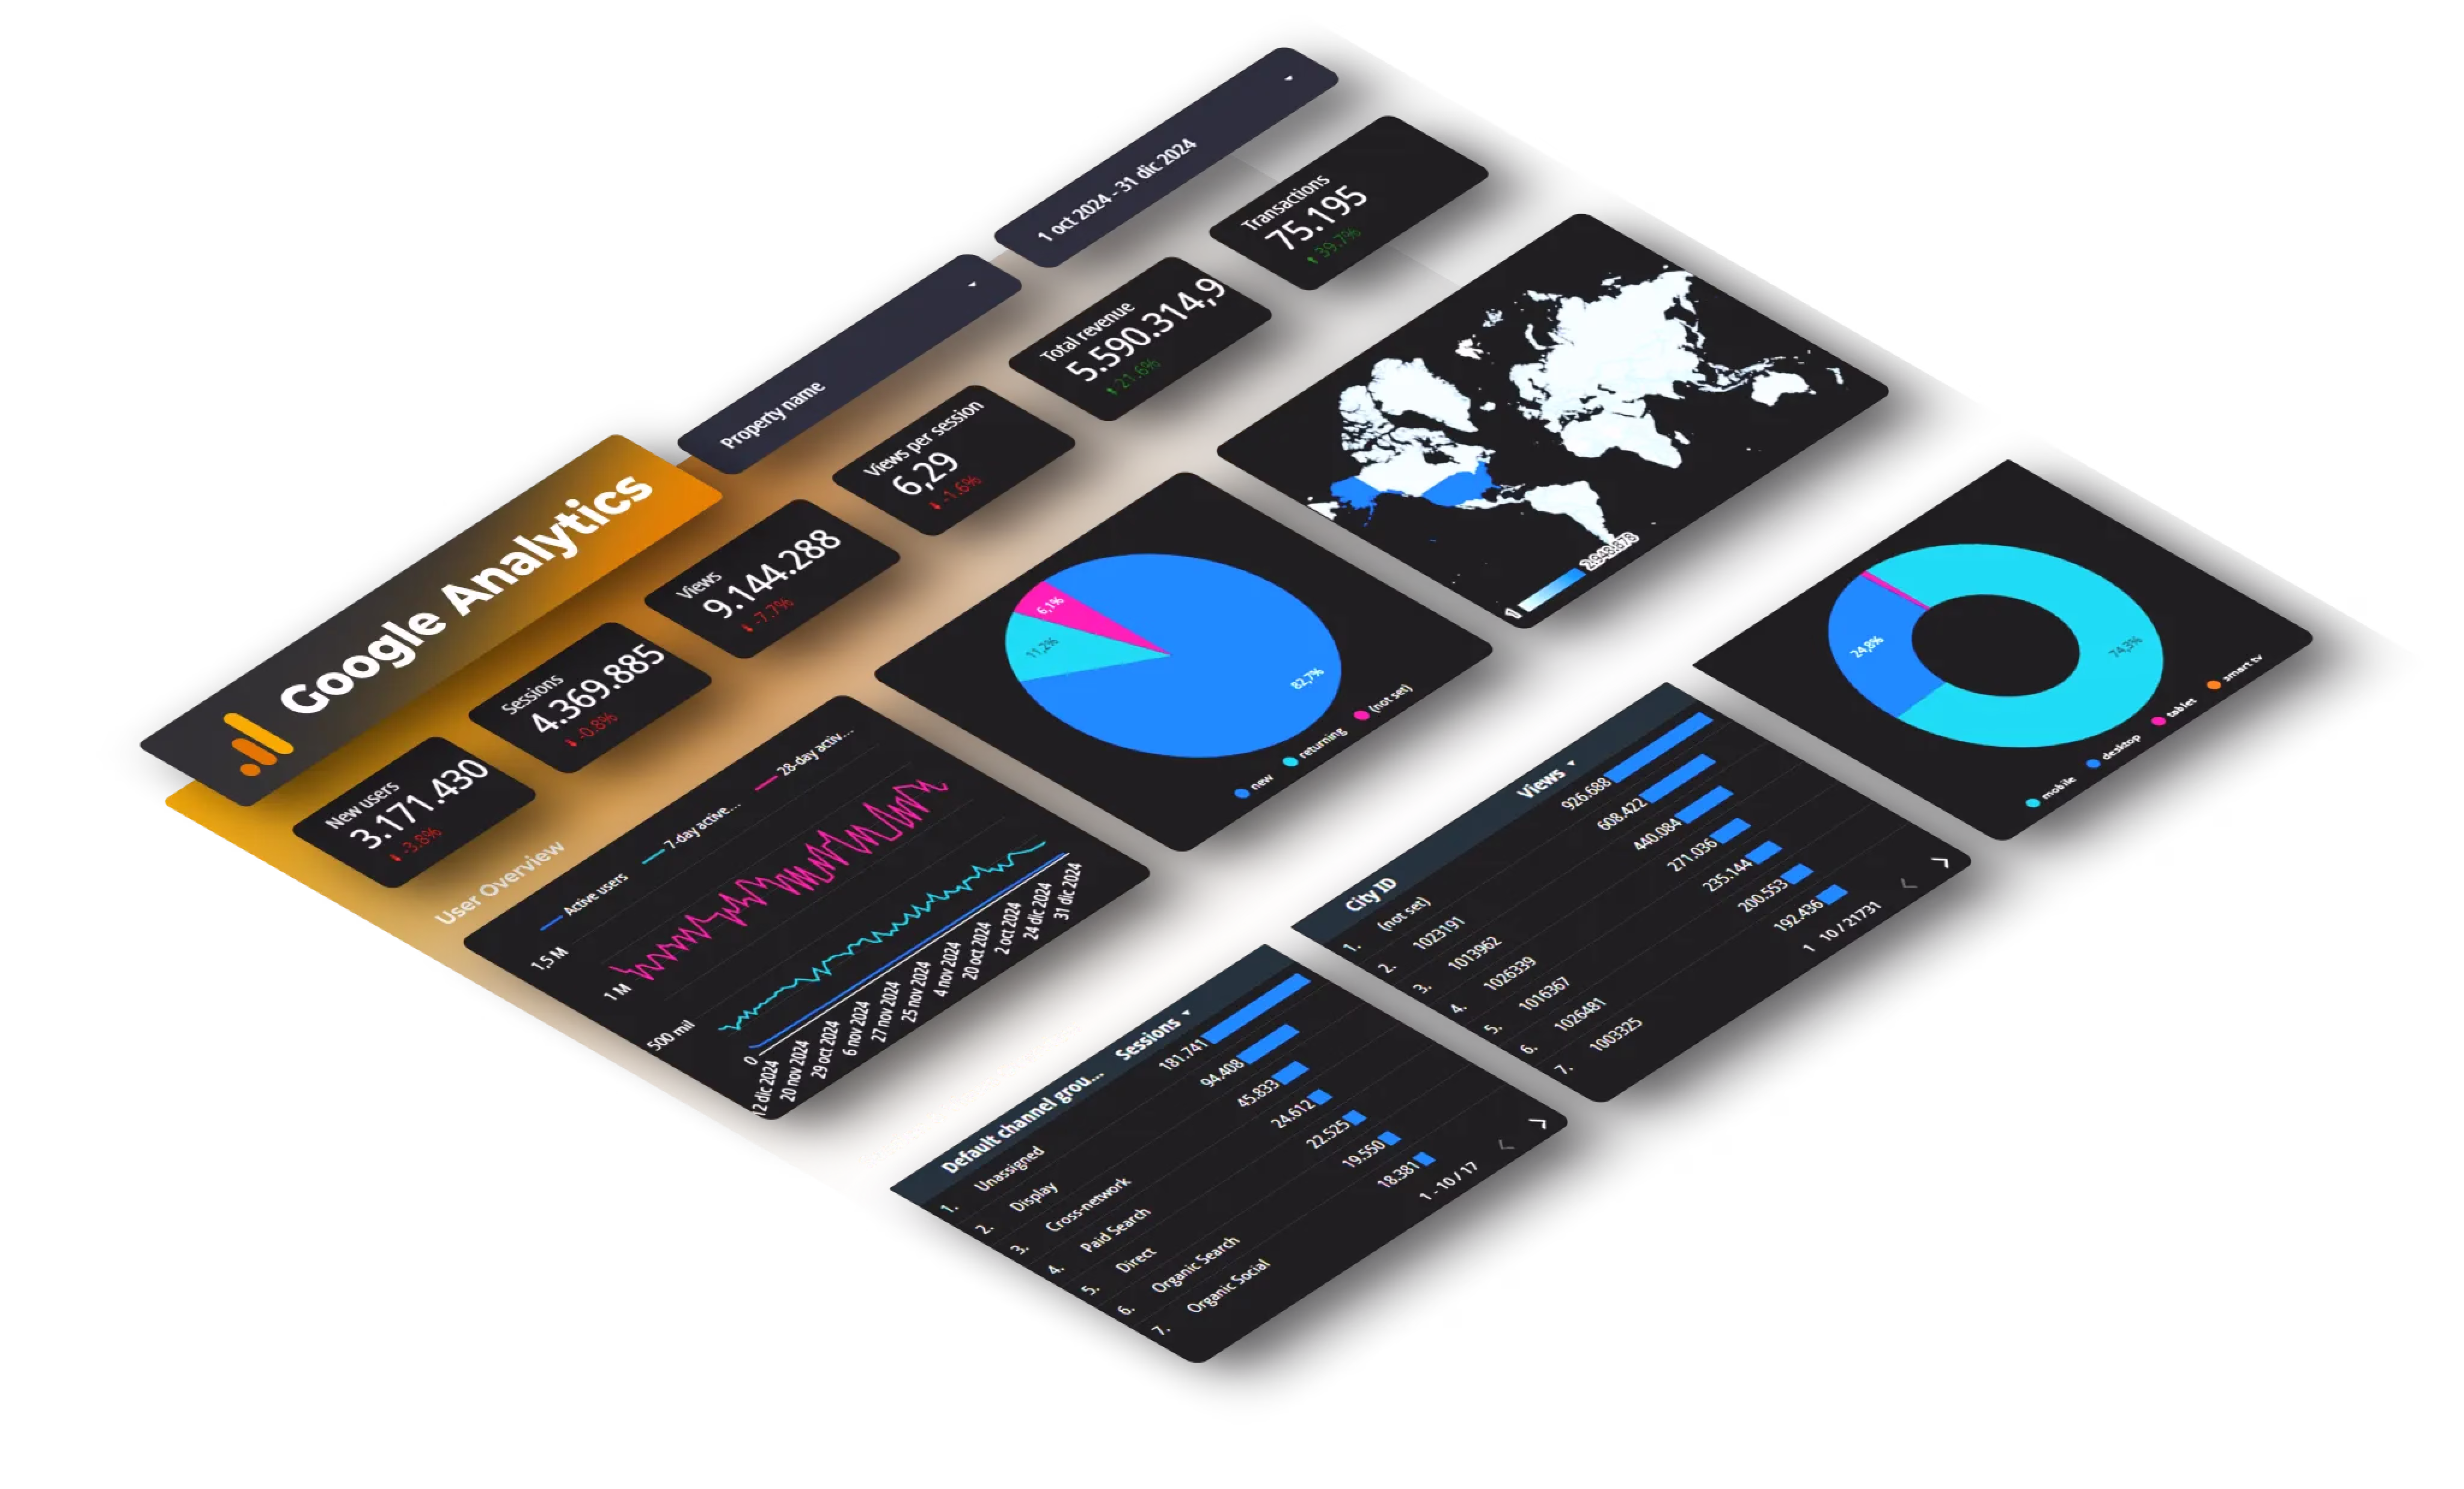
Google Analytics 4: Tracks website behavior, conversions, and user journeys. Free for most businesses.
Google Ads reporting: Built-in dashboards show campaign performance, but exporting data for custom analysis takes work.
Facebook Ads Manager: Detailed campaign metrics, but comparing across other platforms requires manual work.
Pros: Free, no setup beyond account creation, real-time data
Cons: Can't combine data across platforms easily, limited customization
Spreadsheet-Based Reporting
Google Sheets: Free, collaborative, familiar to most marketers. Requires manual data entry or automation setup.
Microsoft Excel: More powerful than Sheets for complex calculations, but collaboration is harder.
Pros: Flexible, no cost (or low cost), full control
Cons: Time-consuming, prone to errors, doesn't scale well
Business Intelligence Platforms
Looker Studio: Free visualization tool that connects to Google products and other data sources. Creates interactive dashboards.
Power BI: Microsoft's business intelligence tool with strong Excel integration and enterprise features.
Tableau: Premium visualization platform with advanced analytics capabilities.
Pros: Professional dashboards, interactive, handles large datasets
Cons: Learning curve, may require technical skills
Automated Data Connectors
When pulling data from multiple marketing platforms (5+ sources), connector tools eliminate manual exports. They're particularly useful when creating reports for multiple clients or needing daily/hourly updates.
For example, consolidating Google Ads, Facebook Ads, LinkedIn Ads, TikTok, and GA4 data into a single dashboard without manual exports. These tools handle API authentication, data refresh scheduling, and format normalization.
When to consider automation: You're spending more than 3 hours weekly on manual data exports, you manage 5+ platforms, or you need real-time/daily updates.
FAQ
How often should I create marketing reports?
Daily monitoring for active campaigns with significant spend using automated dashboards. Weekly reports for team reviews and quick adjustments. Monthly reports for strategic planning and stakeholder updates. Quarterly reports for big-picture analysis and budget planning. Match frequency to decision-making needs, if you can't act on daily data, weekly is sufficient.
What's the difference between marketing reports and dashboards?
Reports are point-in-time snapshots (usually PDFs or presentations) with analysis and recommendations. They capture performance for a specific period. Dashboards are live, interactive views that update automatically. Use dashboards for monitoring; reports for strategic review with context.
How do I calculate marketing ROI accurately?
Basic formula: (Revenue - Marketing Cost) / Marketing Cost × 100. But accurate ROI requires correct attribution. Include all costs: ad spend, tools, freelancers, internal team time. Use multi-touch attribution when possible. Track customer lifetime value, not just first purchase, a $500 acquisition cost looks bad until customers spend $3,000 over two years.
Which metrics matter most for marketing reports?
Universal metrics include: conversion rate (funnel effectiveness), cost per acquisition (efficiency), return on ad spend (profitability), customer lifetime value (long-term impact), and traffic quality (audience relevance). Channel-specific additions: Quality Score for Google Ads, engagement rate for social media, open rate for email, keyword rankings for SEO. Avoid vanity metrics unless they connect directly to business outcomes.
How can I make marketing reports more actionable?
Every section should answer "so what?" and "what next?" Include specific recommendations with priority levels, resource requirements, and expected impact. Use conditional formatting to highlight what needs attention. Break large datasets into manageable insights, instead of "here's 500 keywords," show "these 10 keywords drive 60% of conversions." Include context for every number. End with clear action items assigning owners and deadlines.
What's the best way to report on multiple marketing channels?
Create a unified dashboard showing blended metrics: total spend, total conversions, overall ROAS, and blended CPA. Then provide channel-specific breakdowns. Use consistent date ranges and attribution windows across platforms. Standardize naming conventions. Track inter-channel effects, how SEO and paid search support each other. Most importantly, automate data collection so you're not manually exporting from six platforms weekly.
How do I handle attribution in marketing reports?
Be transparent about which attribution model you're using. Last-click is simple but gives too much credit to bottom-of-funnel channels. First-click over-credits awareness campaigns. Time-decay balances between them. Data-driven attribution (available in GA4 and Google Ads) uses machine learning to distribute credit based on actual conversion paths. Document your model in reports and use consistently. Show attribution comparisons occasionally so stakeholders understand how different models change results.
Conclusion
Building effective marketing reports starts with asking the right questions, tracking metrics that matter, and presenting insights that drive decisions.
Start simple:
- Define what you need to know
- Identify which metrics answer those questions
- Choose a reporting format
- Build your first report manually to understand the data
- Automate once you know the process works
Your first report won't be perfect. Build, get feedback, iterate. Most successful reporting systems evolved from simple spreadsheets into sophisticated dashboards over months.
Want to automate multi-platform reporting? Try Dataslayer free for 15 days to connect Google Ads, Facebook, LinkedIn, TikTok, GA4, and 50+ other marketing platforms to Google Sheets, Looker Studio, BigQuery, or Power BI.


