Google Ads shows plenty of data about your PPC performance: spend, impressions, clicks, conversions, and more. But understanding what's actually driving results across campaigns, ad groups, ads, keywords, and other dimensions requires deeper analysis.
Conversion reporting adds another layer of complexity. You compare Google Ads and GA4, and the numbers don't match. Missing Google Click IDs, consent-related tracking limitations, different attribution models, and conversion settings can all contribute to reporting discrepancies.
Dataslayer's MCP connector doesn't fix tracking issues, but it lets Claude retrieve the latest Google Ads data right from your source account and combine it with metrics from other platforms, such as GA4, Meta Ads, Bing Ads, and 65+ other platforms, for AI-assisted cross-channel analysis.
This guide walks you through connecting Google Ads to Claude using Dataslayer MCP and other available methods. You'll also find practical prompts for analyzing PPC performance from different angles and comparing results across your marketing platforms.
From raw Google Ads data to your first AI-powered insights in just three quick steps. Here we go!
Connect Google Ads to Claude in 3 steps with Dataslayer
What you need to get started
Before connecting Google Ads to Claude, make sure you have the following things in place:
- A Dataslayer account. You can start with a free trial to set up the connection. Register your account now.
- Access to your Google Ads account. You need to have a Google Ads account with appropriate permissions. Read-only access is sufficient.
- The Dataslayer MCP connector. You install the Dataslayer native connector through Claude's Connectors directory in 1 click.
- A Claude account. You can add the Dataslayer MCP connector even on the free Claude plan.
Google Ads to Claude integration steps
Step 1: Authorize Google Ads inside the Dataslayer Hub
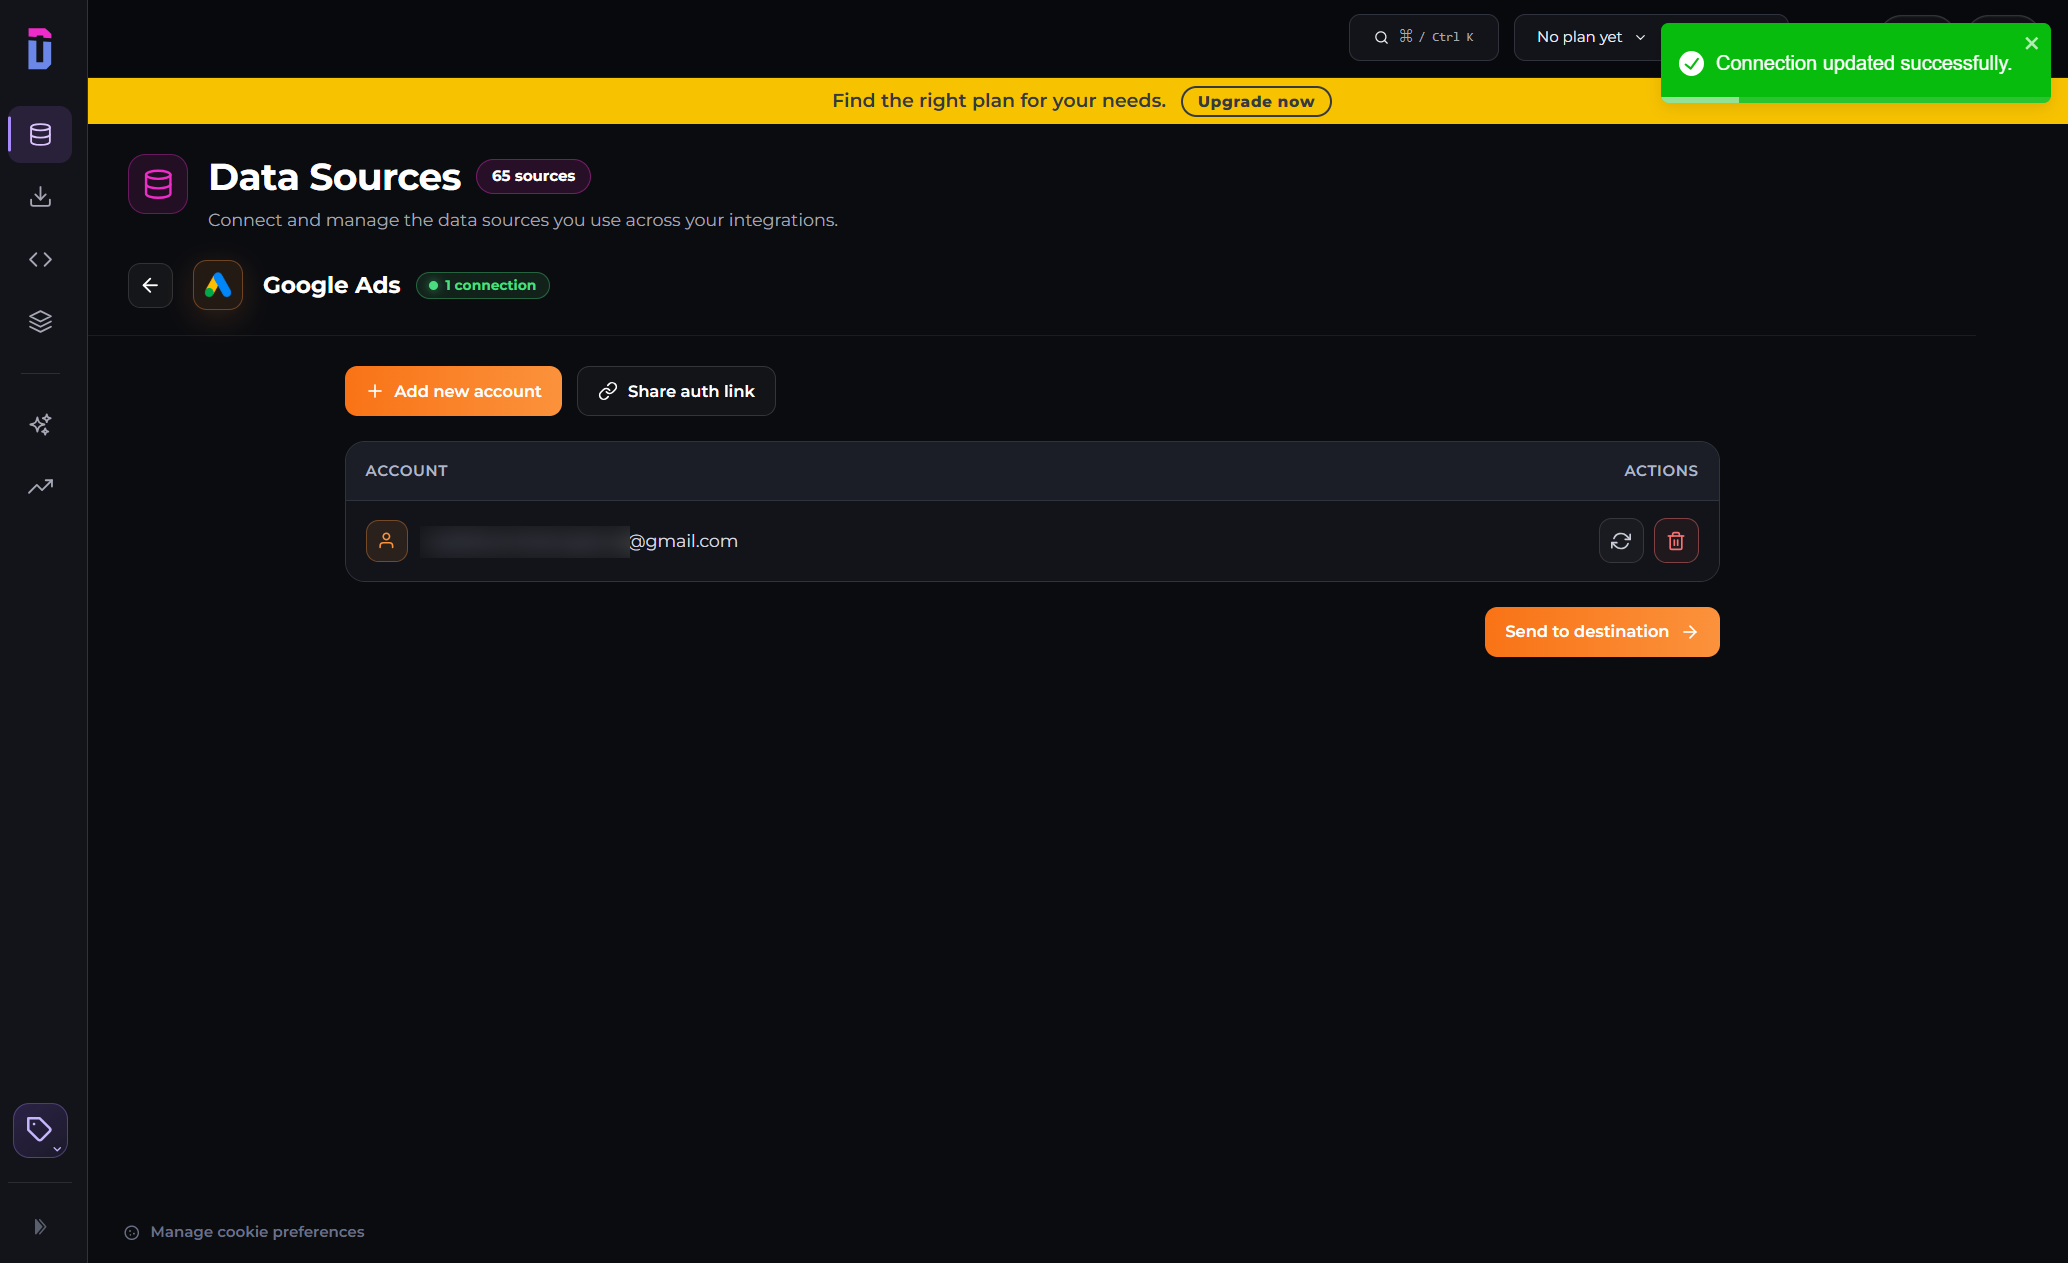
- Open the Dataslayer Data Sources Hub.
- Find Google Ads in the list of data sources and click + Add new account.
- Sign in with the Google account that has access to your Ads account.
- Review the Google consent screen and approve the requested permissions.
- Select the Google Ads accounts you want to connect, then complete the authorization.
- Your Google Ads account should now appear as connected.
Step 2: Install the Dataslayer MCP connector in Claude
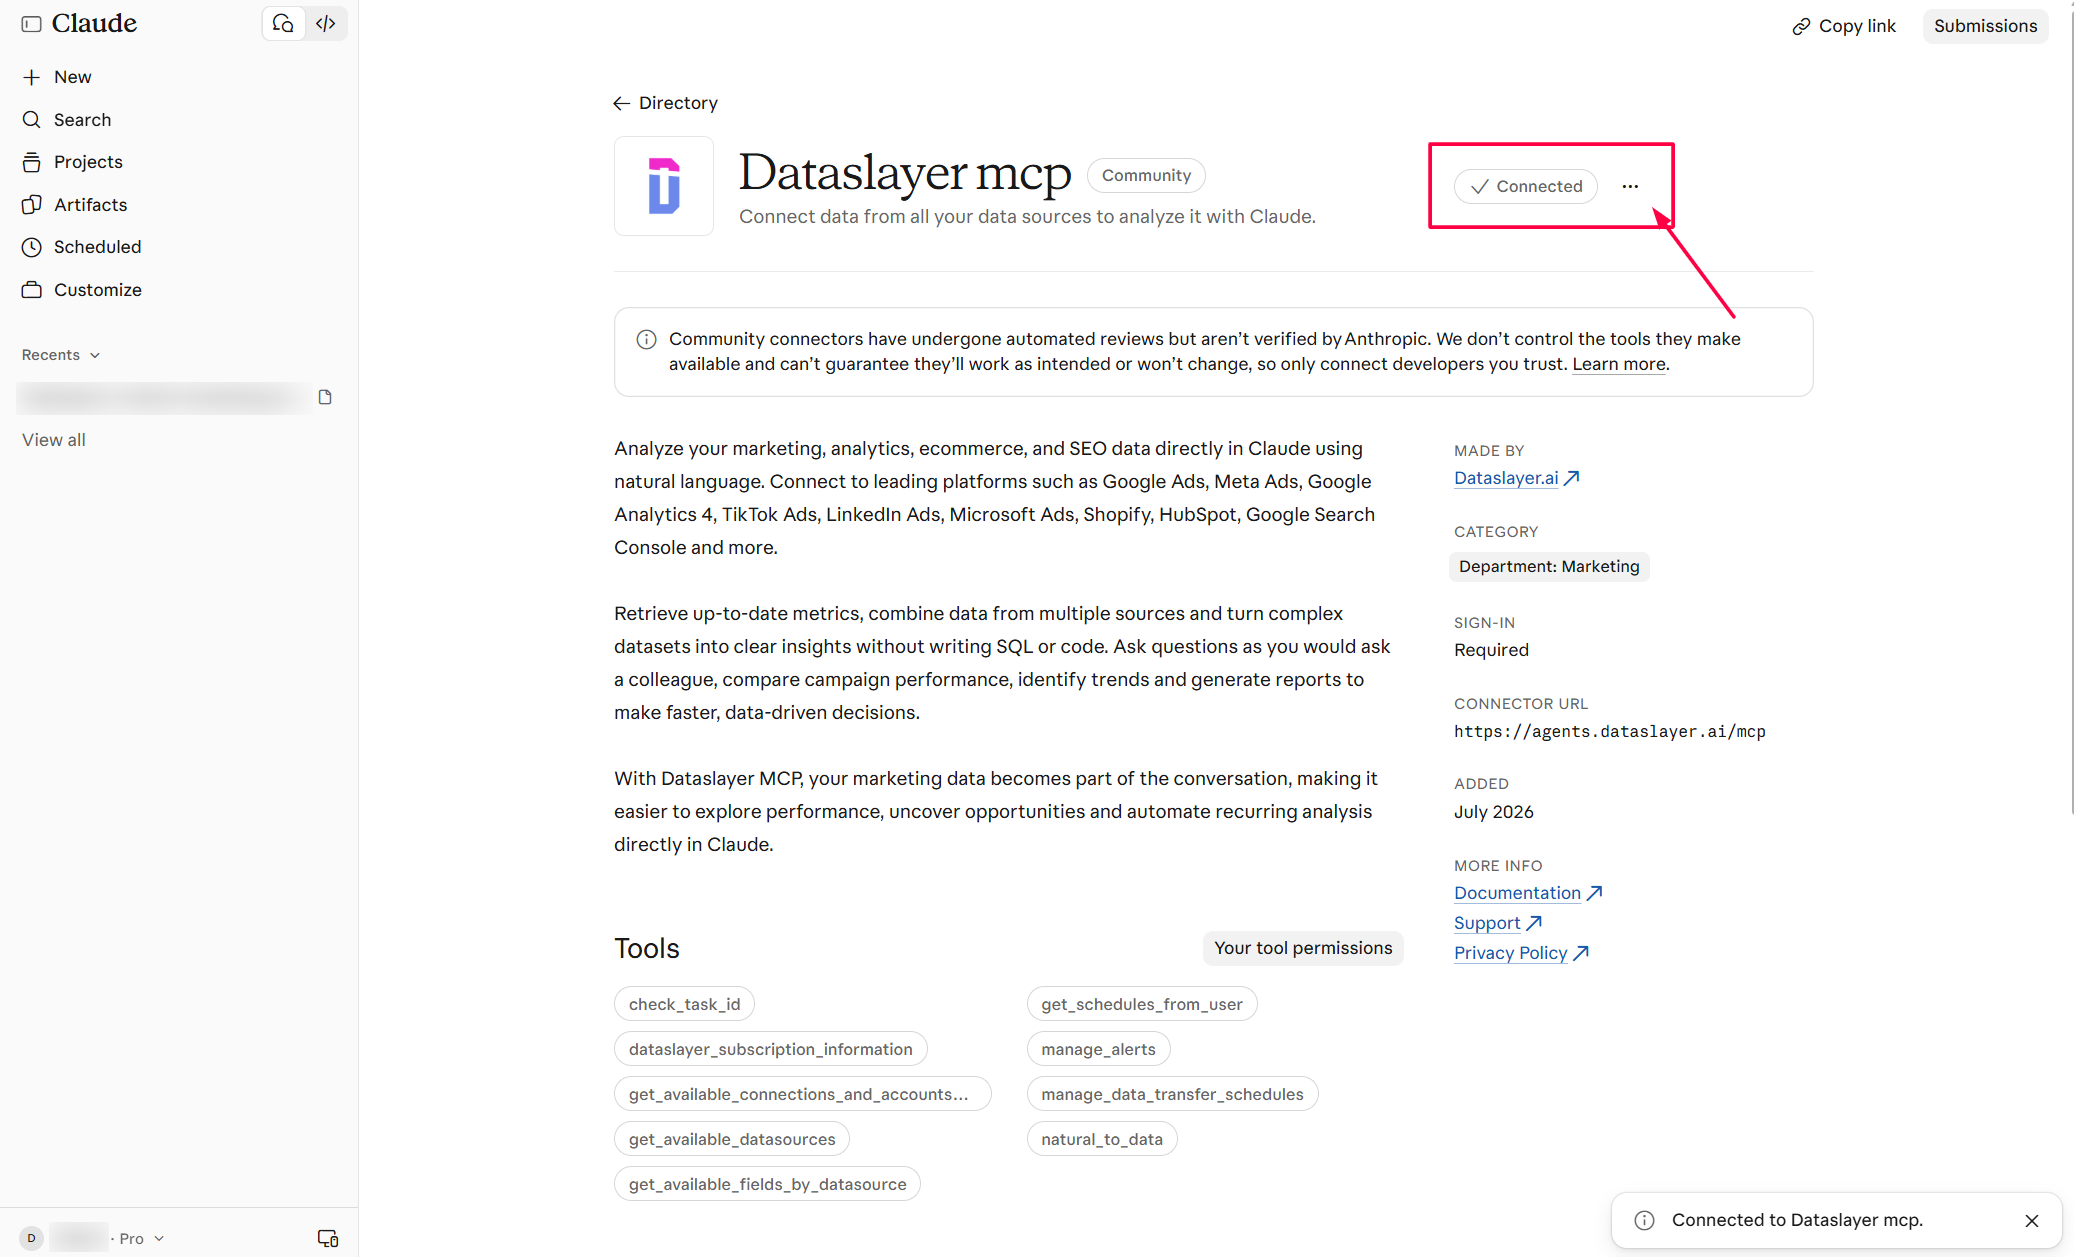
- Open the Dataslayer MCP listing in Claude's Connectors Directory and click Connect.
- Alternatively, you can find it in Settings → Connectors → Discover, search for Dataslayer, and select Connect.
- If prompted, sign in to your Dataslayer account and authorize the connection.
- Once connected, Dataslayer should appear in Claude's connector settings.
Step 3: Start talking to your Google Ads data in Claude
Start a new chat in Claude and ask your first question about your Google Ads data. It’s recommended to use a straightforward request that specifies the metrics, date range, and breakdown you want.
For example:
“Using Dataslayer MCP, show total cost, impressions, and clicks for my Google Ads account over the last 30 days, broken down by campaign.”
Claude should retrieve your account data and return a campaign-level breakdown.
If it returns no data or asks which account you mean, check that Google Ads is connected in Dataslayer, the MCP connector is authorized in Claude, and the correct account is selected.
Google Ads metrics and dimensions available in Claude
Dataslayer gives Claude access to a broad range of Google Ads metrics and dimensions, covering campaign performance, conversions, keywords, and ad quality. You can use these fields to track daily spend, compare campaign results, or understand what's affecting an ad group's Quality Score.
The table below lists the Google Ads fields most useful for these analyses.
For the complete list of available fields, visit Dataslayer's Google Ads documentation.
Google Ads reporting challenges Claude can help solve
Google Ads reports plenty of performance data, but some metrics need closer investigation before you can act on them.
Three common reporting issues are worth understanding:
- Quality Score doesn't explain what needs fixing. Google Ads gives you a score from 1 to 10, but the number alone doesn't tell you whether ad relevance, expected CTR, or landing page experience is holding performance back.
- Google Ads and GA4 can report different conversion totals. Differences may come from attribution models, conversion windows, counting methods, modeled conversions, and how each platform records events. Those differences can make campaign performance harder to reconcile.
- Search campaigns include Search Partners by default. Unless you separate the network in your reporting, campaign totals combine Google Search traffic with traffic from partner sites. That can obscure where clicks and conversions are coming from.
With live account access, Claude can help break down these differences, compare performance across dimensions, and surface patterns that are harder to spot in the standard dashboard.
Google Ads questions Claude can answer: prompt ideas
Based on the fields supported by Dataslayer, you can conduct advanced analysis covering campaign performance, keyword efficiency, and other questions that go beyond the raw numbers in your Google Ads dashboard.
Below are ten widespread Google Ads analytical use cases with ready-to-use prompts. Just replace the bracketed values with your account details and thresholds.
1. Weekly spend trends and spikes
Prompt:
"Compare Cost and Return on ad spend (ROAS) by week for [account] across the last 8 complete weeks. Flag weeks where Cost increased by more than 20% over the preceding week."
What you get: A weekly spend and return trend highlighting unusually large changes. Google Ads can spend up to twice a campaign's average daily budget on a given day, so a daily spike doesn't necessarily indicate a problem. Weekly changes provide a broader view, though you should still check whether the increase reflects campaign activity, seasonality, or a budget change.
2. Top and worst performing ads
Prompt:
"For [account] over the last 30 days, show Ad, Cost, Clicks, Conversions, and Cost per conversion by Ad within [campaign]. Rank ads from best to worst by Cost per conversion, flag ads with high Cost and zero Conversions, and give me an action list for optimizing underperformers."
What you get: A side-by-side view of your strongest and weakest ads, plus concrete next steps for underperformers. Claude can suggest which ads to review, where to test new creative, and which campaigns may need budget adjustments.
3. Search terms and negative keyword opportunities
Prompt:
"For [account] over the last 30 days, show Search term, Cost, Clicks, and Conversions. List search terms with Cost above [amount] and zero Conversions."
What you get: A shortlist of search terms spending money without recorded conversions. Review their relevance and conversion history before adding them as negative keywords. A term with no conversions in 30 days isn't automatically wasted spend.
4. Quality Score diagnostics
Prompt:
"Identify keywords in [account] with a Quality Score below 5, including Quality Score, Ad relevance, and Landing page experience. Rank them from lowest to highest Quality Score."
What you get: A list of low-scoring keywords alongside their available diagnostic components. This helps identify whether ad relevance or landing page experience needs attention. Quality Score is a keyword-level diagnostic, not an ad-group performance metric.
5. Performance Max vs. Search campaigns
Prompt:
"For [account] over the last 30 days, show Cost, Conversions, and Return on ad spend (ROAS) by Advertising channel type. Compare Performance Max against Search."
What you get: A comparison of spending and conversion performance across Performance Max and Search campaigns. ROAS helps assess conversion value relative to spend, although the comparison doesn't explain differences in campaign objectives or attribution.
6. Wasted spend by campaign
Prompt:
"Show the 10 campaigns with the highest cost last month, including Cost, Conversions, and Cost per conversion. Flag any campaign with Cost above [amount] and zero Conversions."
What you get: Campaigns with substantial spend but no recorded conversions during the selected period. These deserve a closer look at targeting, conversion tracking, and conversion lag before you decide whether to reduce spend.
7. Device performance
Prompt:
"For [account] over the last 30 days, show Cost, Clicks, CTR, and Conversions by Device."
What you get: A breakdown of performance across mobile, desktop, and tablet. Comparing conversion activity and click costs can reveal differences worth exploring in device-level performance.
8. Ad group efficiency check
Prompt:
"Rank ad groups within [campaign] for [account] by Cost per conversion, from lowest to highest, including Cost and Conversions."
What you get: A comparison of ad groups within one campaign, highlighting where conversion costs differ. Use conversion volume and campaign objectives alongside cost per conversion before deciding where to adjust spend.
9. Match type efficiency
Prompt:
"For [account] over the last 30 days, show Cost, Clicks, CPC, and Conversions by Keyword Match Type. Compare Broad against Phrase and Exact."
What you get: A comparison of spend, click costs, and conversion activity across match types. The results help assess whether Broad match is bringing in useful traffic relative to Phrase and Exact, rather than assuming one match type performs better.
10. Conversion value concentration
Prompt:
"Break down Conversion Value, Conversions, and Return on ad spend (ROAS) by Campaign for [account] over the last 90 days. Flag campaigns contributing more than 50% of total Conversion Value."
What you get: Campaigns accounting for a large share of recorded conversion value. This helps identify where reported revenue is concentrated and which campaigns deserve closer monitoring before significant budget or bidding changes.
Go further: Compare Google Ads with GA4, Meta Ads, and Bing Ads
Once Dataslayer MCP is connected to multiple marketing platforms, Claude can analyze Google Ads alongside GA4, Meta Ads, and Bing Ads in the same conversation.
This makes it easier to compare campaign performance, investigate reporting discrepancies, and understand how your paid media channels contribute to overall results without exporting separate reports, as well as identify opportunities to adjust campaigns across platforms.
Here are some cross-channel analyses you can try:
Use case 1: Do Google Ads clicks match GA4 sessions?
Prompt:
"Compare Google Ads Clicks for [account] with GA4 Sessions attributed to Google / cpc for [property] over [start] to [end]. Group the results by week and flag weeks where the difference exceeds [X]%."
What you get: A weekly comparison of Google Ads clicks against GA4 sessions attributed to Google / cpc. Large differences can point to tracking or attribution issues worth checking, including consent restrictions, redirects that interfere with Google Click ID parameters, or differences in how clicks and sessions are counted. The comparison helps narrow down the problem, but doesn't establish whether auto-tagging is working on its own.
Use case 2: How do Performance Max conversions compare across Google Ads and GA4?
Prompt:
"Identify Performance Max campaigns in Google Ads account [account] over the last 30 days. Compare weekly Google Ads Conversions and Conversion Value with GA4 Key Events and associated event value for the corresponding campaigns. Match campaigns using Google Ads campaign IDs where available, or exact campaign names otherwise. Show the absolute and percentage differences, and flag campaigns with the largest discrepancies."
What you get: A campaign-level comparison of Performance Max conversion reporting in Google Ads and GA4. This helps identify where conversion counts or values differ and which campaigns deserve further investigation. Keep in mind that the platforms may use different attribution models, conversion definitions, and reporting methods, so their numbers won't necessarily match. GA4 provides another perspective on performance, not a direct validation of Google Ads conversion totals.
Use case 3: How does Google Ads compare to Meta Ads?
Prompt:
"Compare monthly Cost, Clicks, and Conversion Value for Google Ads account [account] and Meta Ads account [account] over [date range]. Calculate each platform's share of combined spend and compare CPC."
What you get: A side-by-side view of spending, traffic, and conversion value across both platforms. Comparing CPC and conversion value can help identify where mirrored campaigns perform differently and where targeting, bidding, or budget allocation may need adjustment.
Google Ads integration methods for Claude compared
Dataslayer is one way to connect Google Ads to Claude.
Other options include Google's own MCP server, third-party connectors, and custom API integrations. Each method differs in setup requirements, pricing, supported platforms, and available functionality.
Let's compare them closely:
- Google's own MCP server for Google Ads. Google's open-source MCP server provides read-only access to Google Ads through the Google Ads API and GAQL. It's free to use, but you need to configure a Google Cloud project and authentication credentials, then run or host the Python server yourself. The setup process can take a few hours and involves technical expertise. Also keep in mind that Google Ads MCP covers Google Ads alone, so cross-platform analysis requires additional custom integrations.
- Porter Metrics and Supermetrics. Both connect Google Ads and other marketing platforms to Claude without requiring you to maintain your own server. Porter charges per connected data-source account, starting at $15/month for one account, with volume discounts. Supermetrics Starter costs $44/month billed annually, while Growth costs $177/month billed annually. Both plans include Claude as a destination, subject to their respective account and data-source limits.
- Manual CSV exports. Exporting Google Ads data costs nothing extra and works well for a one-off analysis. You can ask Claude to summarize performance, identify patterns, or compare campaigns from the file. The limitation is keeping the data current and combining it with other platforms: each new reporting period requires another manual export, and cross-platform analysis means bringing the files together yourself.
- Building directly with the Google Ads API. The API gives developers full control over how Google Ads data is retrieved, processed, and presented. You need to configure a Google Cloud project, authentication, and API access, then write and maintain the integration yourself. Unlike an MCP connector, the API doesn't provide a ready-made conversational interface; you'd build that layer or connect your implementation to an MCP server.
Here is how those options compare side by side:
Information checked: November 2026
Google Ads in Claude: Best practices, limitations, and other things you should know about
Best practices: Turn Google Ads analysis into a repeatable workflow
These three habits will help you turn one-off questions into effective reporting workflows you can reuse:
- Dig deeper without another export. Keep follow-up questions in the same conversation. After ranking keywords by Quality Score, ask Claude to group them by campaign or identify ad groups with the most low-scoring keywords. It can build on the earlier results without starting from scratch.
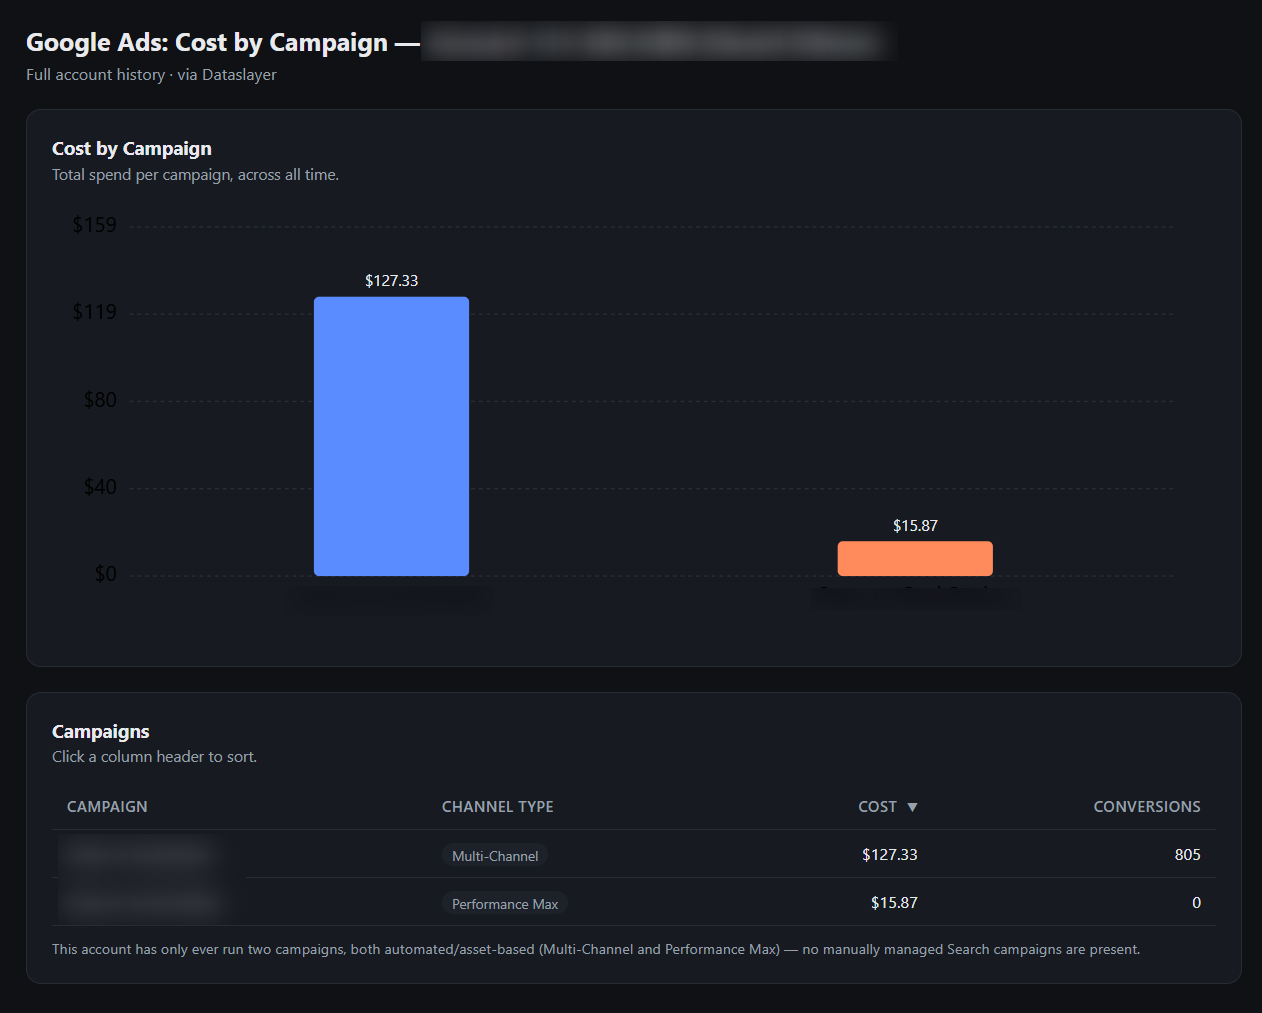
- Hand off a chart, not a screenshot. After reviewing weekly performance, ask Claude to "create an interactive artifact with a line chart of weekly Cost by Advertising channel type and a table of keywords sorted by Quality Score." You’ll get a visual report with charts and tables you can explore, rather than a static screenshot.
- Stop repeating yourself every session. Create a Claude Project for Google Ads reporting and add standing instructions, such as: "Use account [ID]. Don't infer placement-level performance for Performance Max. Group results by Year-Week, using complete weeks only. Report spend in the account's currency." Project instructions apply across chats in that Project, so you don't have to repeat your reporting preferences every time. Keep in mind that data retrieved in one conversation doesn't automatically carry over to another.
Google Ads reporting limitations to account for
Google Ads has several reporting quirks worth accounting for when analyzing campaign performance:
- Quality Score can be missing. New keywords or those with insufficient recent activity may return a null Quality Score. Exclude missing values when calculating averages.
- Recent conversion totals can change. Conversions may continue arriving for days or weeks after an ad interaction, depending on the conversion window. Treat recent totals as provisional until conversion reporting has caught up.
- Search includes Search Partners by default. Search campaign totals can include traffic from partner sites. Use the Network dimension to separate Google Search from Search Partners before comparing performance.
- Account currencies aren't automatically converted. Google Ads reports spend in each account's currency, and Dataslayer doesn't provide a converted total. Confirm currencies match before combining spend across accounts.
- Conversion value can include adjustments. Google Ads value rules can increase or decrease reported conversion values based on audience, location, or device. Check for value rule adjustments when ROAS differs from expectations.
- Relative date ranges can cause confusion. Confirm how the connector interprets dates against your Google Ads account's time zone. For precise comparisons, specify exact start and end dates.
Google Ads to Claude troubleshooting
If Claude can't connect to Google Ads or returns unexpected results, these are the most common causes and fixes.
FAQs
What's the best way to connect Google Ads to Claude?
Dataslayer MCP is a practical choice if you want Google Ads alongside other marketing platforms without managing your own integration. Google's official Google Ads MCP server is a free, open-source alternative for developers comfortable configuring authentication and running their own server. For a one-off analysis, exporting a CSV and uploading it to Claude may be all you need.
What can I do with Claude for Google Ads analysis?
Claude can help with budget pacing, search term reviews, Quality Score diagnostics, Performance Max comparisons, wasted spend checks, device performance, and ad group efficiency. You can also compare match types and identify campaigns contributing a disproportionate share of conversion value.
Can I analyze Google Ads alongside other platforms?
Yes. Dataslayer MCP lets Claude query Google Ads, GA4, Microsoft Advertising, and other connected marketing platforms in the same conversation. You can compare campaign spend, traffic, and conversions across channels without exporting separate reports first. Just make sure currencies, attribution models, and date ranges are consistent before comparing totals.
Can Claude edit my Google Ads campaigns through Dataslayer MCP?
No. Dataslayer MCP currently provides read-only access to Google Ads data. You can analyze campaign performance and retrieve reporting data, but campaign edits, bid changes, budgets, and targeting adjustments still need to be made in Google Ads.
Why use Dataslayer MCP instead of a Google Ads MCP server for Claude or a DIY build?
Dataslayer removes the need to host, configure, and maintain your own integration. Its biggest advantage is cross-platform access: the same connection can bring Google Ads, GA4, Microsoft Advertising, and dozens of other marketing sources into Claude. That becomes particularly useful when your analysis spans multiple channels rather than a single Google Ads account.
Is there an automated way to send Google Ads data to Claude?
Yes. Dataslayer MCP retrieves Google Ads data through the API when Claude requests it, so you don't need to export a new CSV for every analysis. Google's own MCP server also supports on-demand API queries. Neither approach requires you to maintain a manually exported reporting file.
How much does Dataslayer MCP for Google Ads cost?
Dataslayer MCP access is included in every plan, along with your core destination, with 500 queries/day. For unlimited queries, you can purchase MCP subscription as a separate destination. Starter plan costs $35/month billed annually, with Advanced at $115/month and Pro at $345/month. See our pricing page for the full breakdown. You can start with a 15-day free trial; no credit card required.
Does Dataslayer Google Ads MCP for Claude support Performance Max and Shopping campaigns?
Yes. You can query Performance Max and Shopping alongside Search and Display. Google's channel report provides additional Performance Max breakdowns, but not a complete placement-level view. GA4 offers another perspective on conversions, not where Performance Max spend went.
Why don't Claude's numbers match Google Ads?
Differences can come from conversion lag, attribution settings, reporting filters, account scope, or time zones. Search Partners traffic can also affect comparisons when network settings differ. Match the date range and reporting settings first, and treat recent conversion totals as provisional until reporting has caught up.